The design for the temperature visualisation is based on the concept of the previous paper circuit for the EC probe but uses coloured LEDs that indicate the water temperature in relation to stream health, as listed in the SHMAK manual by NIWA (2008). The idea for using cardboard and copper tape for these prototypes is inspired by the work by Jie Qi (2012) and the High-Low Tech Group at MIT Media Lab (2012).
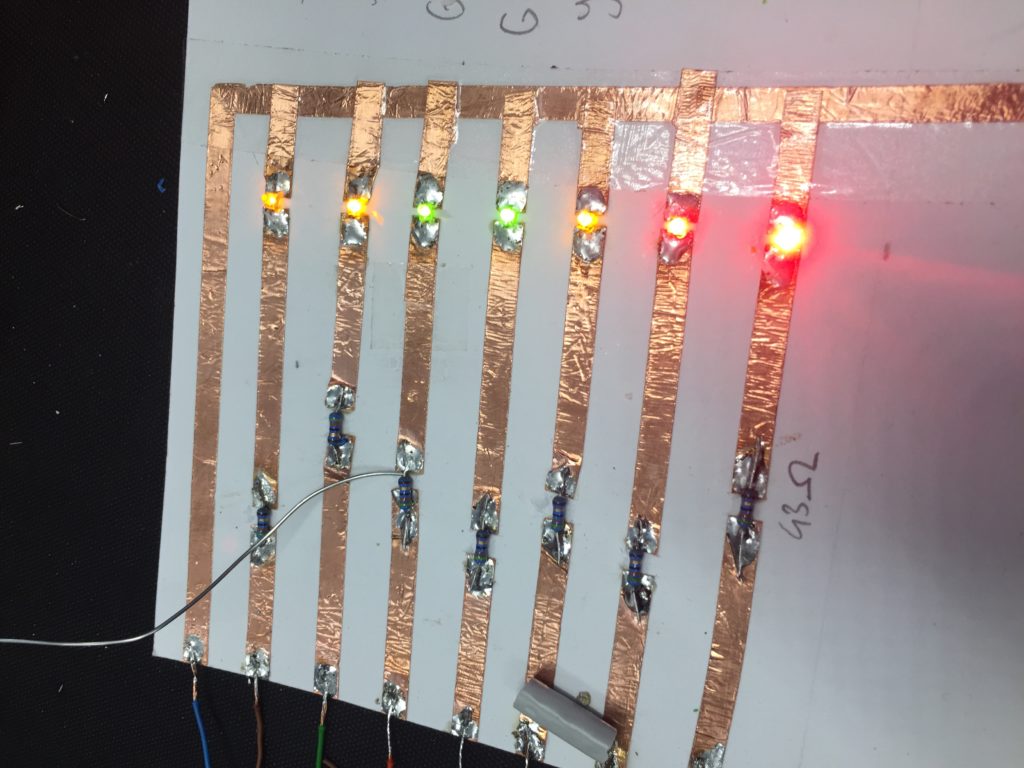
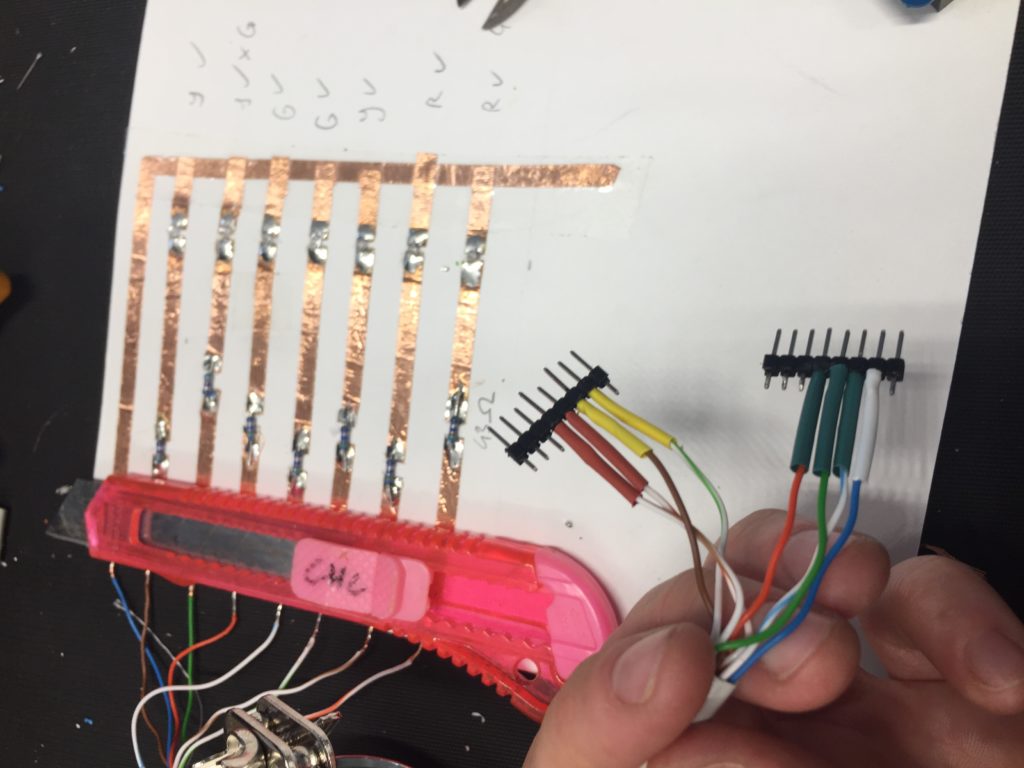
For finishing the circuit, I need to add resistors to the design as they have a smaller forward voltage than the white LEDs I used in the previous design. Using Ohm’s law, I calculated that 43 Ohm resistors are a good choice for all three colours.
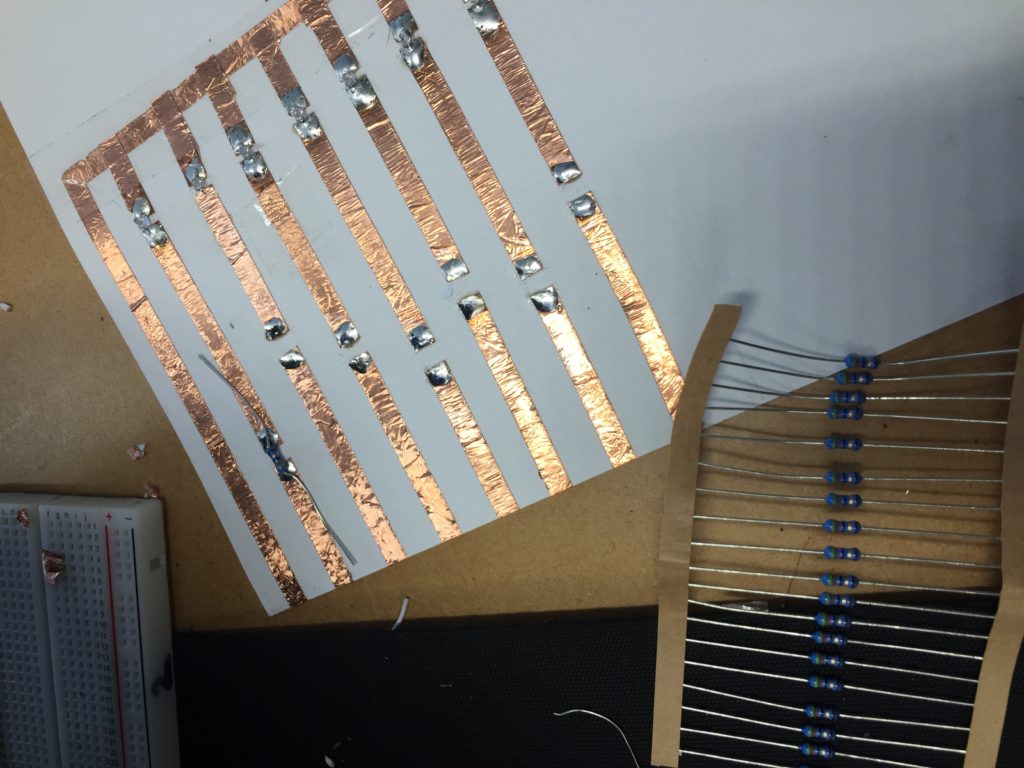
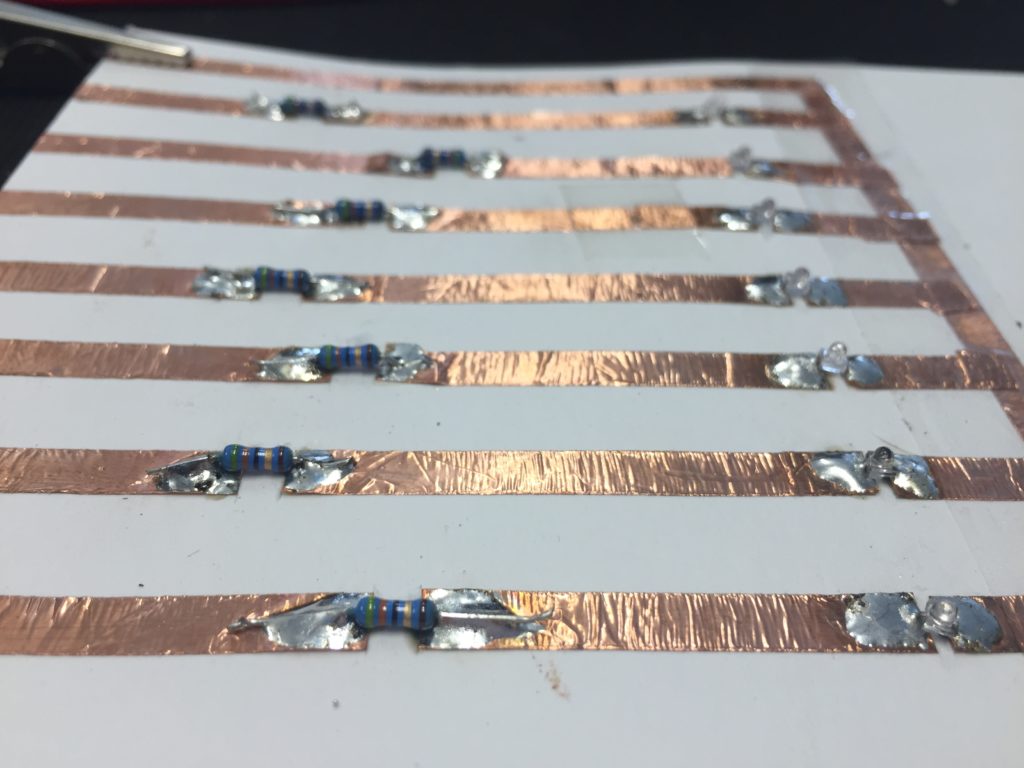
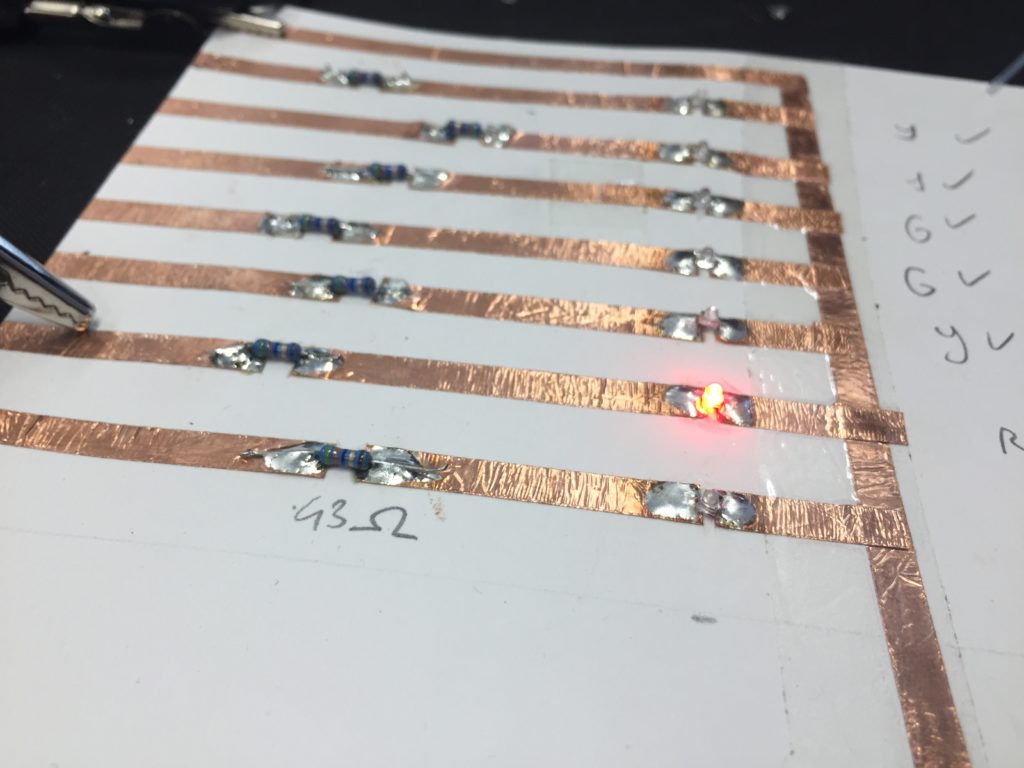
After all the LEDs are lighting up when tested with a constant 3.3V output from a desk power supply, I use a Cat5-cable to connect the paper to two sets of header pins so I can test the work with the WEMOS D1.
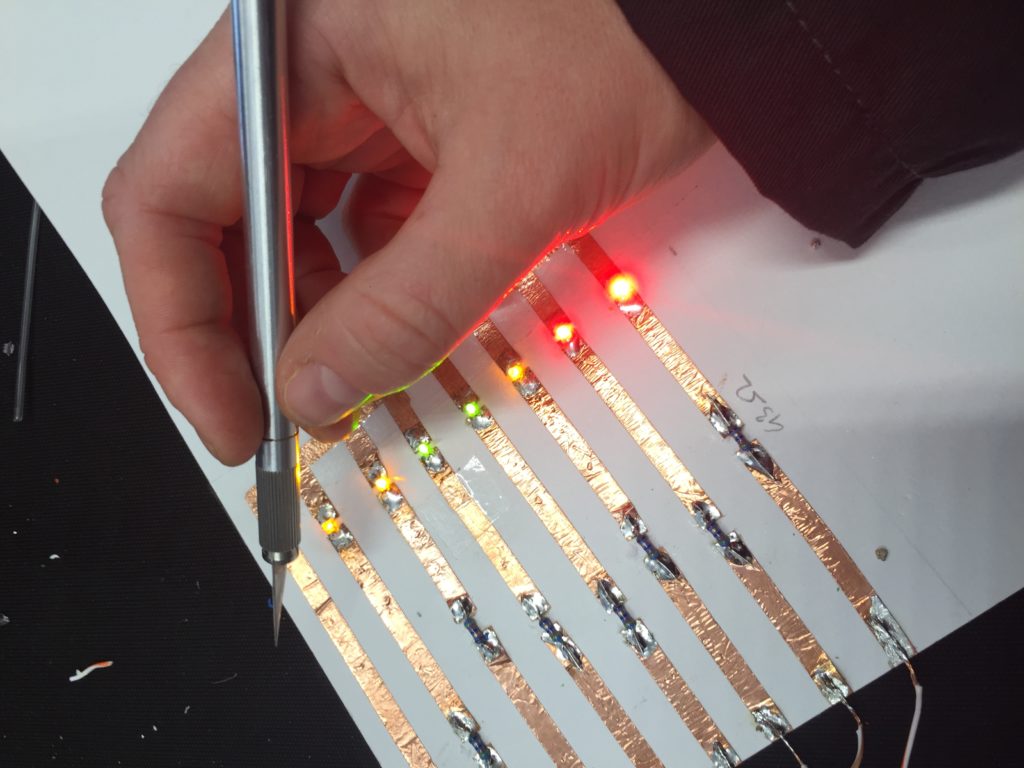
Here you can see me testing the connectivity of components on bent paper. It appears that the angled copper-tape connections are the most fragile element of the design, especially the bent overlap that I have taped down with sellotape. 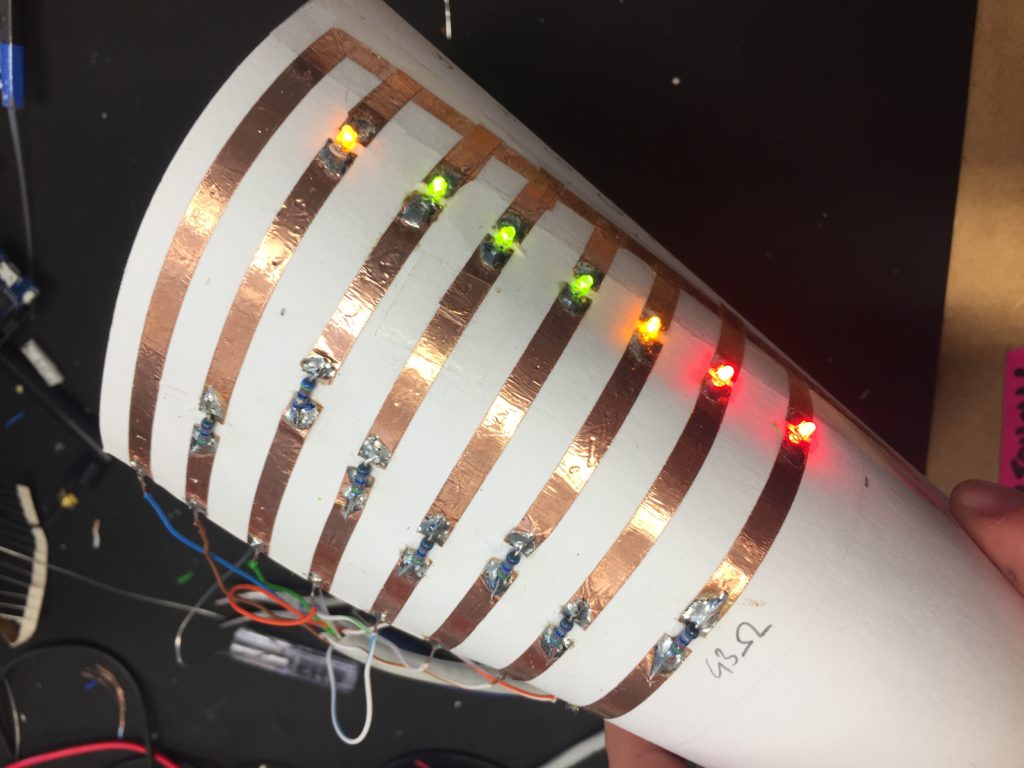
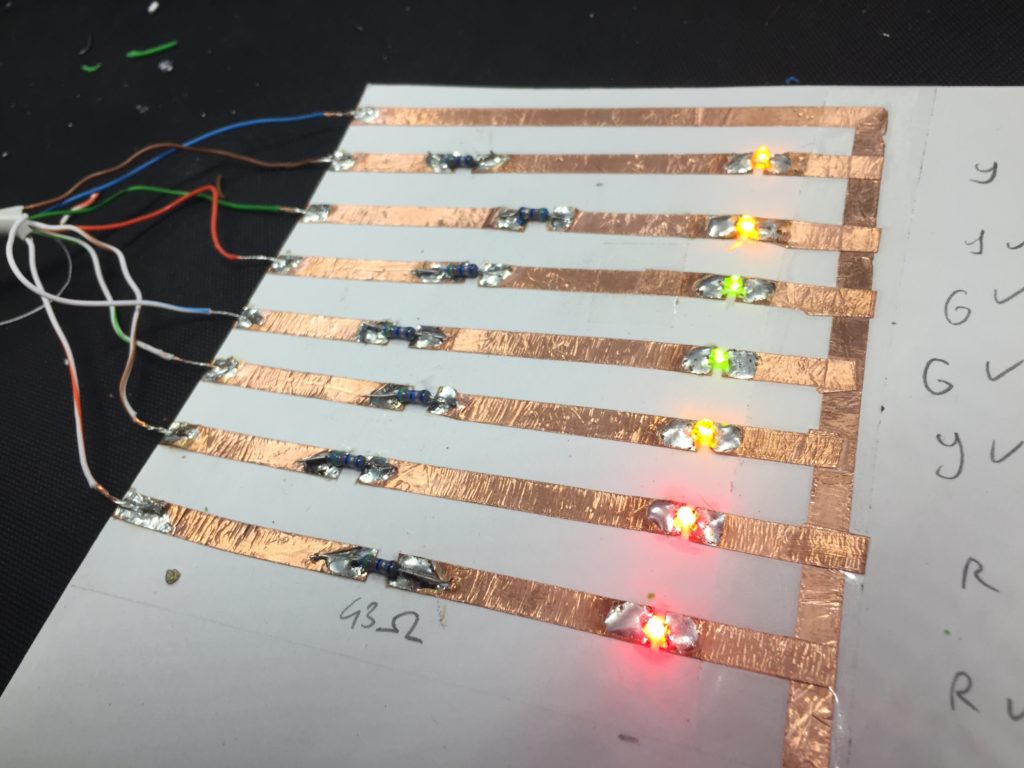
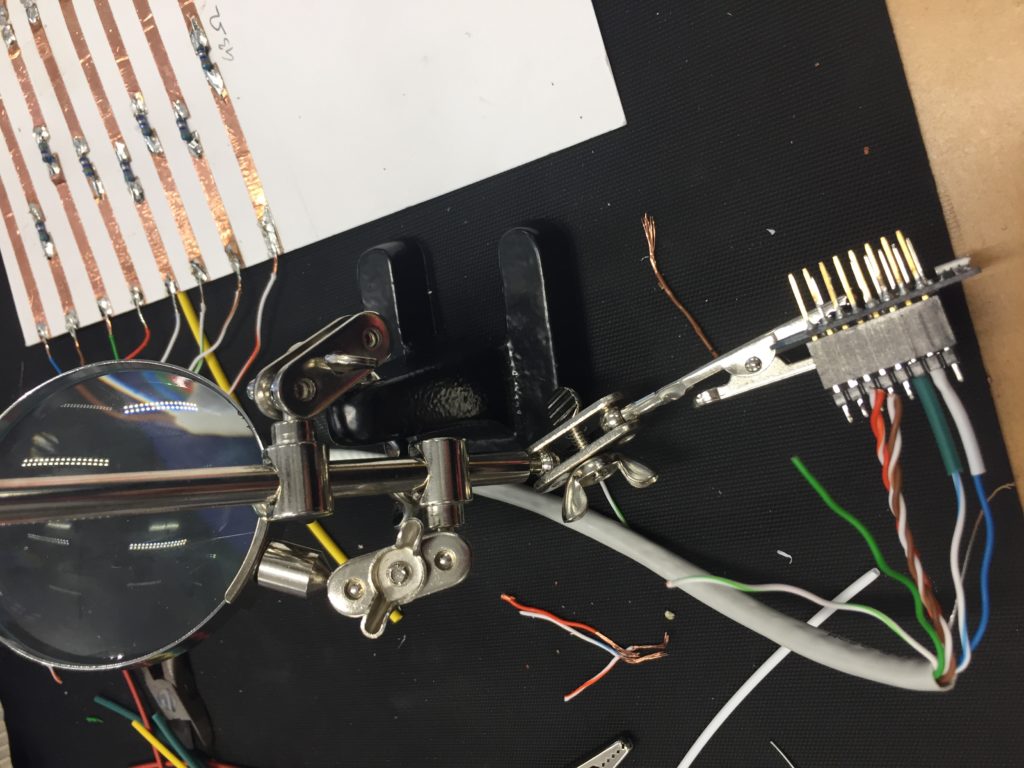
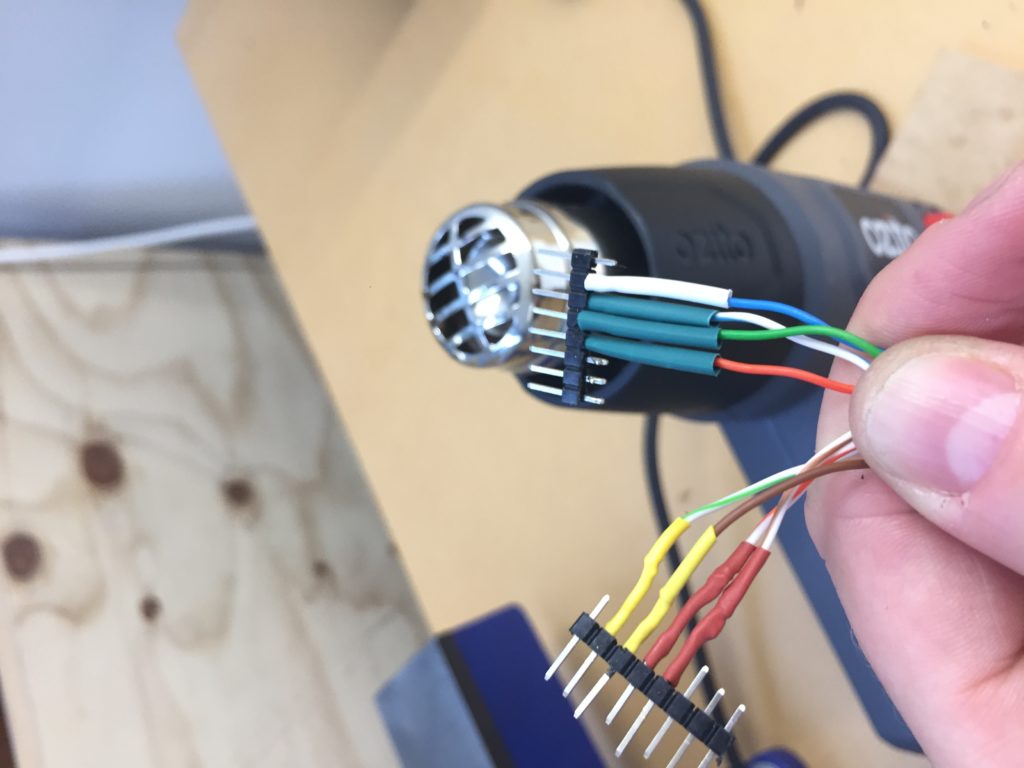
After powering the circuit with the desk power supply once more to test whether the LEDs still work with the cable bridges I add header pins to the end of the cables to provide a stable connection to the Wemos D1 mini microcontroller. I use colored heat shrink at the end of the header pins to identify cables with the respective LED color for more clarity if debugging is required later.
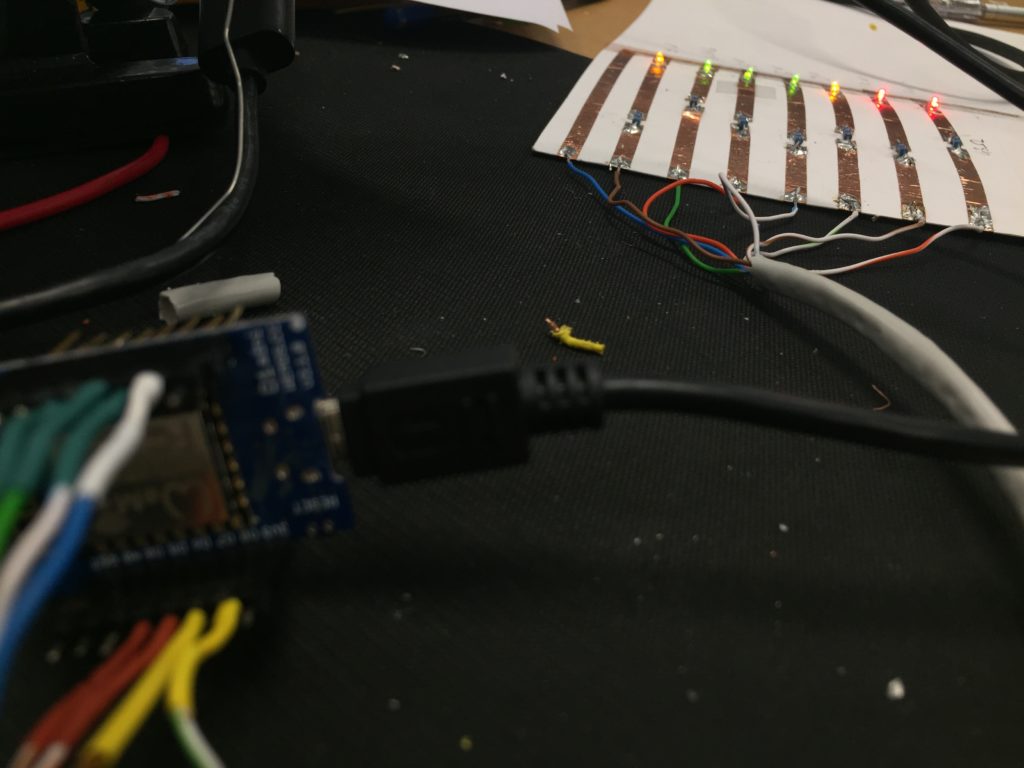
The next step involves addressing all LEDs correctly with the Wemos D1 mini.
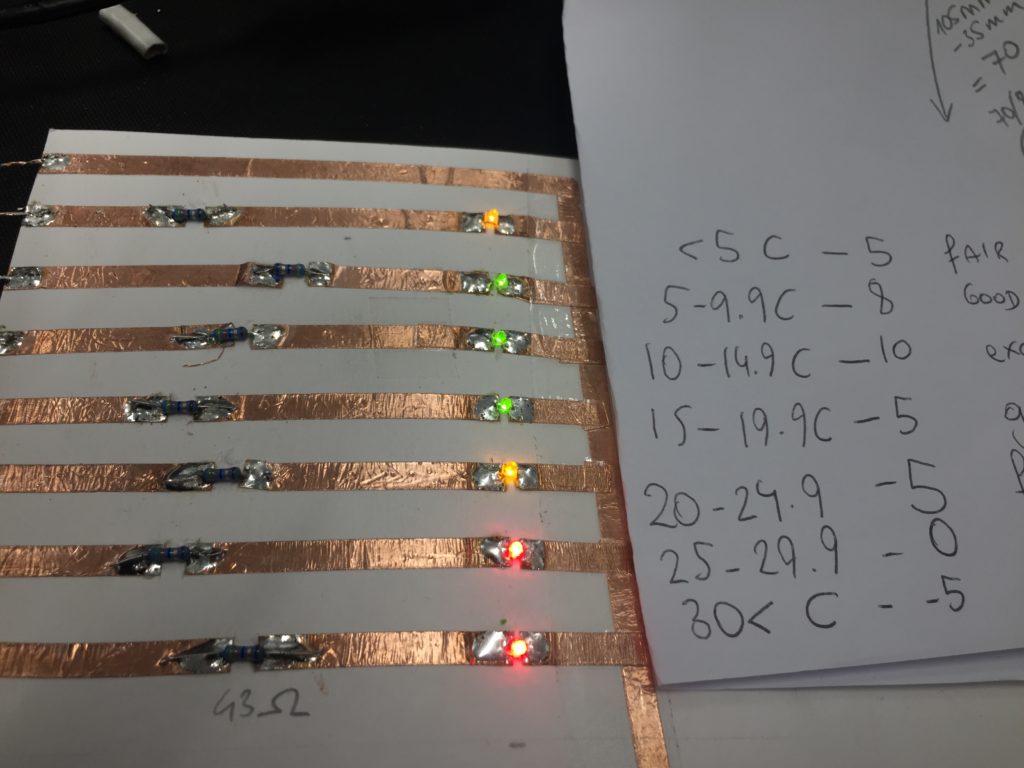
I had previously noted down the temperature ranges from the SHMAK manual (NIWA, 2008) and also added all values to the header comment of the testing code for easier reference later. This information also contains the colour of CAT5-wire strand, the digital pin connected, and the range of temperature as per SHMAK kit and the colour of LED (red/yellow/green) used to represent each state.
After some bugs in my code addressing all LEDs correctly (I ended up using digital ports D1–D8) I finally got all LEDs working with a simple looping sketch.
// Kaituhituhi-rua prototype - temperature

// blue wire - G

// brown wire          D7 - <5°C – 5°C - fair:5 (yel)
// green wire          D4 - 5°C – 9.9°C - good:8 (grn)
// orange wire         D2 - 10°C – 14.9°C - excellent:10 (grn)
// blue/white wire     D4 - 15°C – 19.9°C - good:5 (grn)
// green/white wire    D8 - 20°C – 24.9°C - fair:5 (yel)
// brown/white wire    D5 - 25°C – 29.9°C - poor:0 (red)
// orange/white wire   D6 - 30°C< - poor:-5 (red)


// LEDs
int ledPins[] = {D1, D2, D3, D4, D5, D6, D7, D8};

int ledState[8];

unsigned long previousMillis = 0;

const long interval = 1000;

void setup() {
  for (int p = 0; p < 8; p++) {
    pinMode(ledPins[p], OUTPUT);
    ledState[p] = LOW;
  }
}

void loop() {
  for (int c = 0; c < 4; c++) {
    for (int p = 0; p < 8; p++) {

      digitalWrite(ledPins[p], HIGH);
    }
    delay(500);


    for (int p = 0; p < 8; p++) {

      digitalWrite(ledPins[p], LOW);

    }


    delay(500);
  }

}
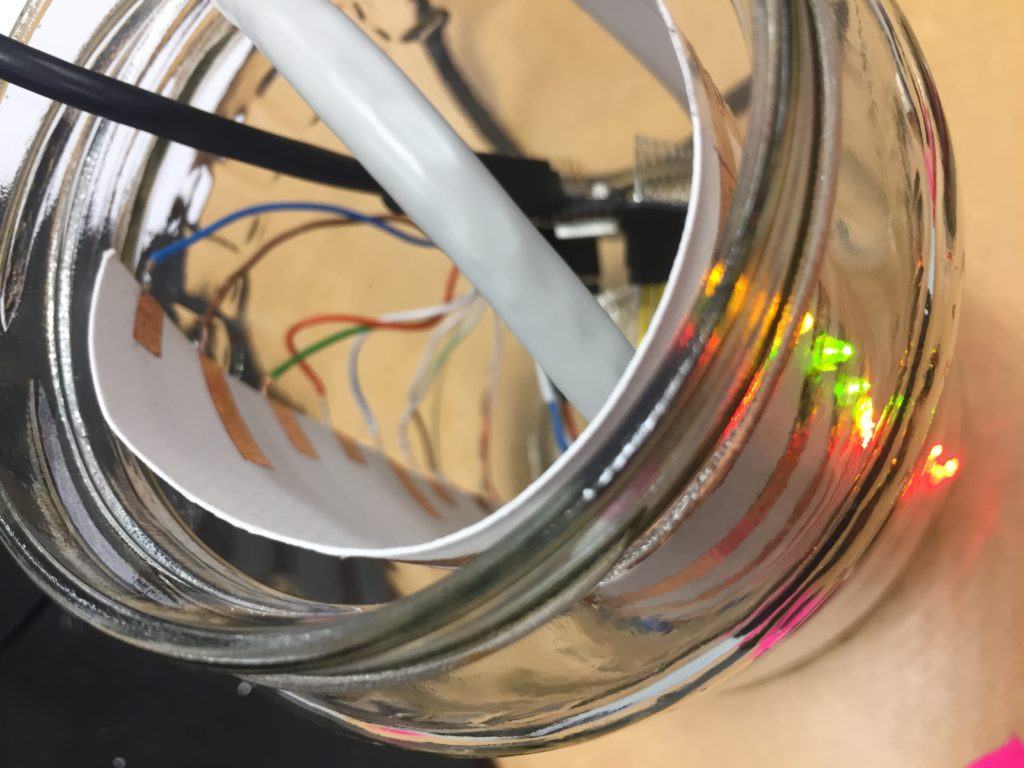
Next, I cut the paper into a smaller size and test how it fits in two different types of jars.
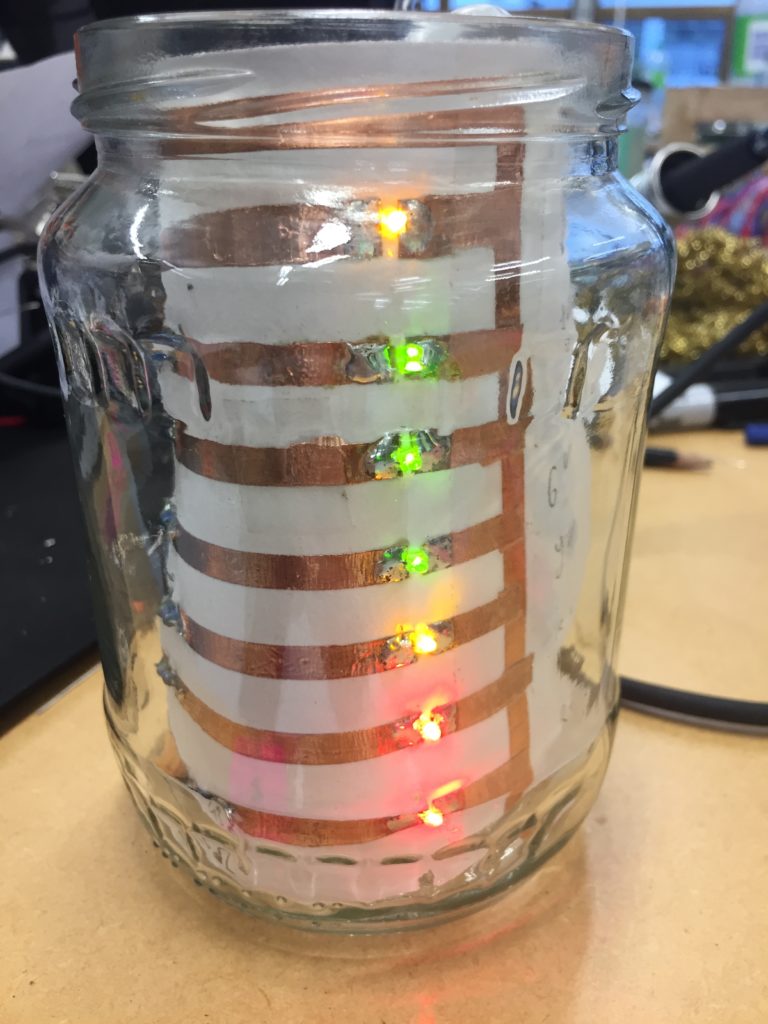
While fitting the paper into the jar I leave the microcontroller connected to evaluate how stable the solder and copper tape connections are. The power supply to the LEDs needs to remain stable while repeatedly inserting and removing the circuit from a jar. The LEDs indeed keep blinking which is a good sign. The smaller jar that was initially intended for the circuit has a pattern on the top and bottom of the glass which diffracts the LEDs and might make it hard to read.
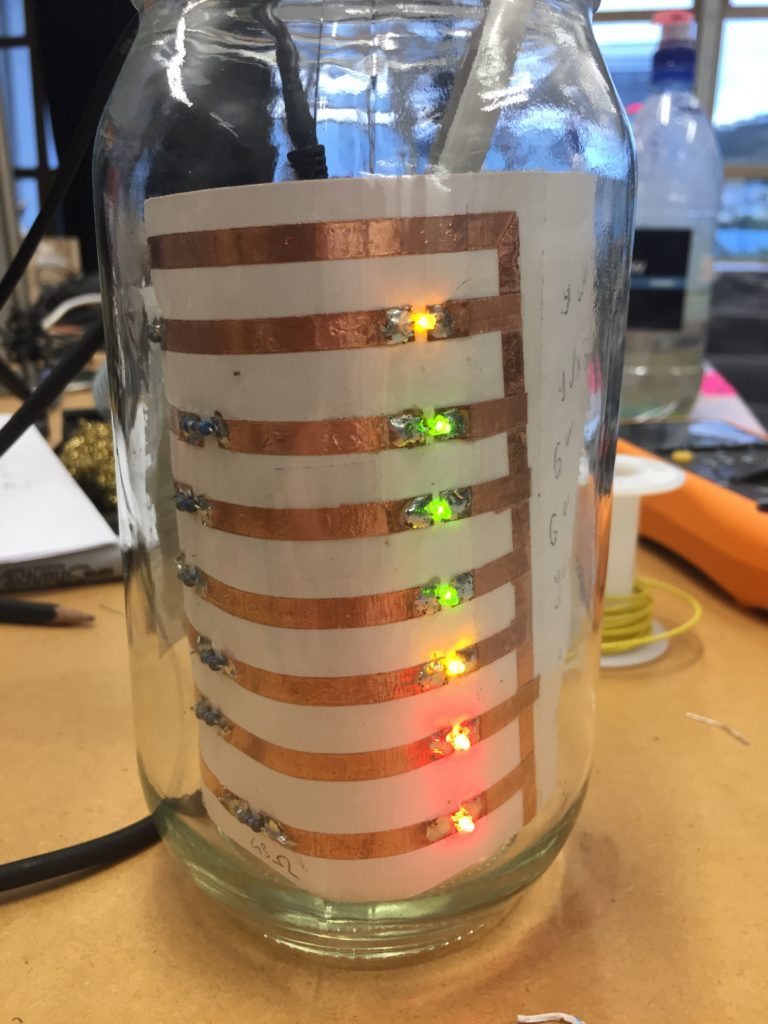
The taller jar is clearer which makes it easier to see the LEDs, but from an aesthetical point of view, the circuit paper would have needed to be cut a bit larger to neatly fill the height of the jar.
In the end, I decide that both jars are suitable from a technical and practical perspective. The final choice of enclosure needs to be made after testing the prototype with the final code, showing only the LED of the respective temperature zone on.