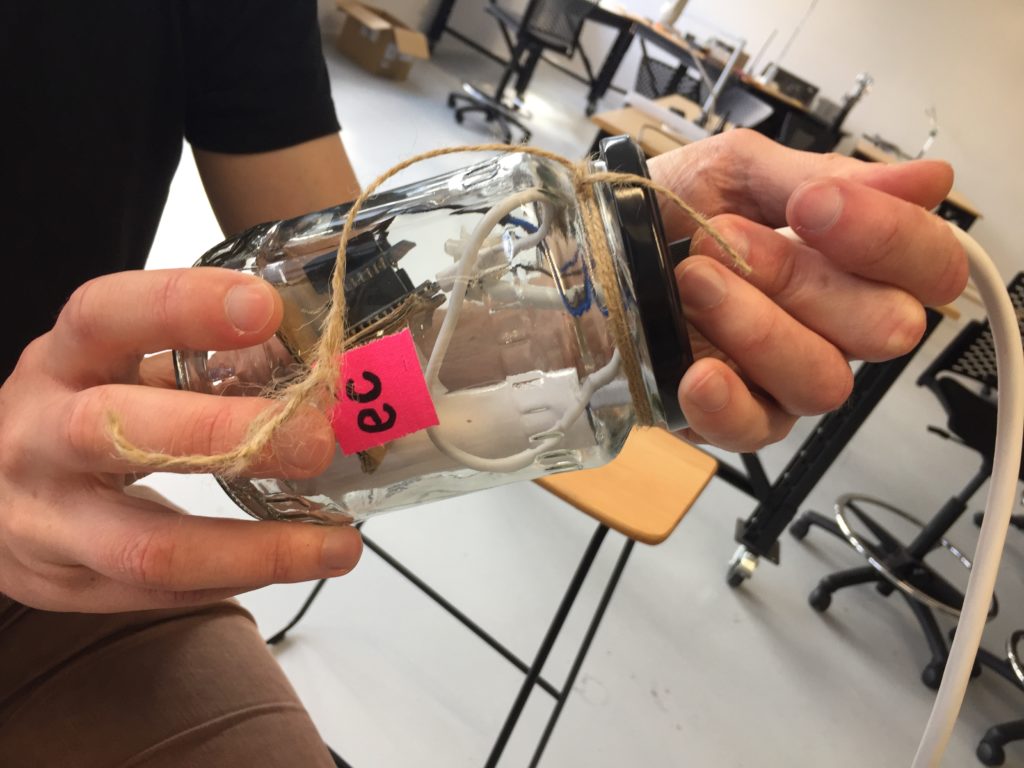
My DIY water sensor nodes need field-compatible outputs so that visitors can easily access and understand the sensor data of the IoT network in real-time. The design for the temperature visualisation is based on the concept of the previous paper circuit for the EC probe, because research participants generally gave the design with cardboard, copper tape and white LEDs positive feedback. For the water temperature jar, however, I am using coloured LEDs, as suggested by one participant. In my development notes below, you can learn how I designed and assembled the device, and how the SHMAK manual (NIWA, 2008) helped to make the visual output meaningful. The idea for using cardboard and copper tape for these prototypes is inspired by the work by Jie Qi (2012) and the High-Low Tech Group at MIT Media Lab (2012).
Development Notes
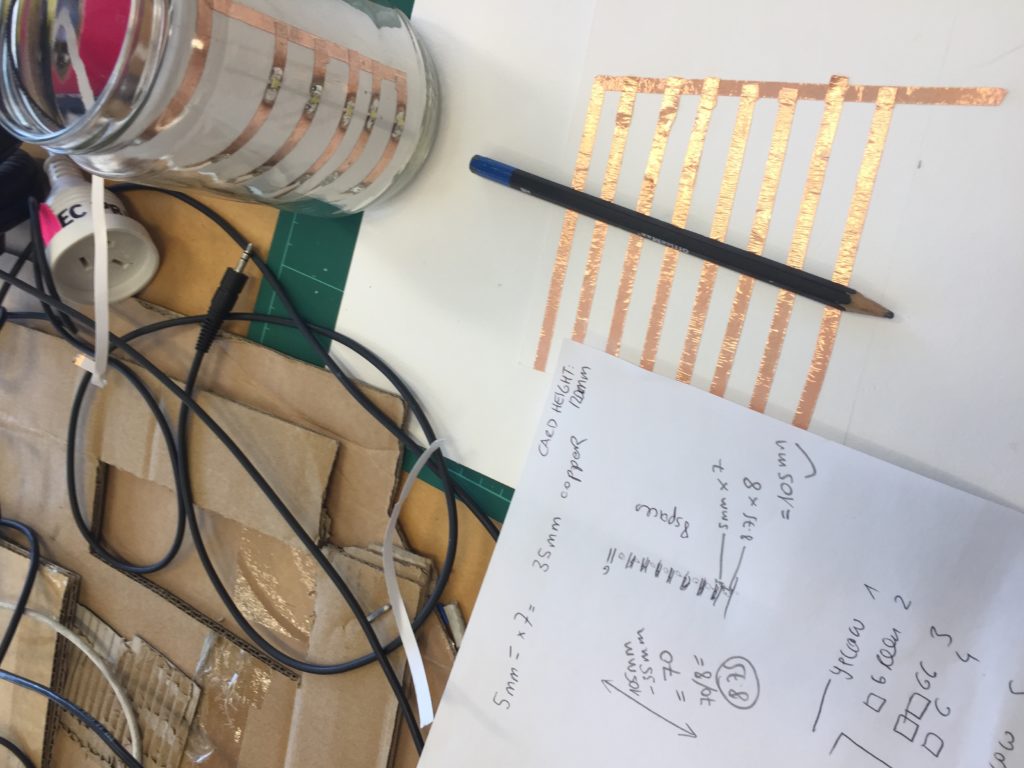
Similar to the previous LED prototype I use a 12cm high sheet of white card paper as a base for my copper tape trails. During an evaluation discussion on the EC jar design, participant 18 suggested the use of coloured LEDs for future iterations. I am attempting to implement this suggestion in the design for the jar that visualises the data coming from the water temperature sensor (DS18B20).
Visualising stream wellbeing
During the ideation phase, I focused on a suitable way to connect coloured lights meaningfully to the water temperature readouts. Hence, instead of opting for a traditional water temperature colour scale for blue (cold) and red (warm) I departed from the perspective of the stream, and what effect water temperature has on the more-than-human wellbeing of the stream.
|
|
| Less than 5 Rating: fair Score: 5 |
Less than 5°CValues below 5 ºC are low and indicative of winter conditions in southern regions. Invertebrate and periphyton growth would be slow in such waters. Some species may be excluded. |
| 5 to 9.9 Rating: good Score: 8 |
5 to 9.9°CValues of 5 to 10°C are moderate to low and indicative of winter conditions. Most invertebrates and periphyton can survive well in these temperatures. |
| 10 to 14.9 Rating: excellent Score: 10 |
10 to 14.9 °CValues of 10 to 15°C are very suitable for most invertebrates and periphyton. |
| 15 to 19.9 Rating: good Score: 5 |
15 to 19.9°CTemperatures of 15 to 20°C will start to be stressful for some invertebrates (e.g., stoneflies). |
| 20 to 24.9 Rating: fair Score: 5 |
20 to 24.9 °CTemperatures of 20 to 25°C are moderately high. Some invertebrates, such as some mayflies, stoneflies, and some fish, such as trout, are unlikely to survive such conditions for prolonged periods (e.g., several weeks). |
| 25 to 29.9 Rating: poor Score: 0 |
25 to 29.9 °CTemperatures between 25 and 30°C are likely to be stressful to fish, stoneflies, mayflies and some caddis flies. Such high temperatures may be a result of lack of shading and very sluggish flows. |
| 30°C or more Rating: poor Score: -5 |
30 °C or moreTemperatures over 30°C are likely to be very stressful to most stream life and result in their death. Again, such high temperatures may be a result of lack of shading and very sluggish flows. However, stream temperatures will rarely get to these levels. |
Table 1: Habitat indicators of stream health. From NIWA (National Institute of Water and Atmospheric Research), 2008.
The table contains seven water temperature bands rated from poor to good. I opt to use one LED for each band, representing the ratings (poor, fair, good, excellent) with colour. I choose red, yellow and green LEDs to indicate the stream health rating:
| Red | Poor |
| Yellow | Fair |
| Green | Good |
| Green x2 | Excellent |
Copper tape circuit design and assembly
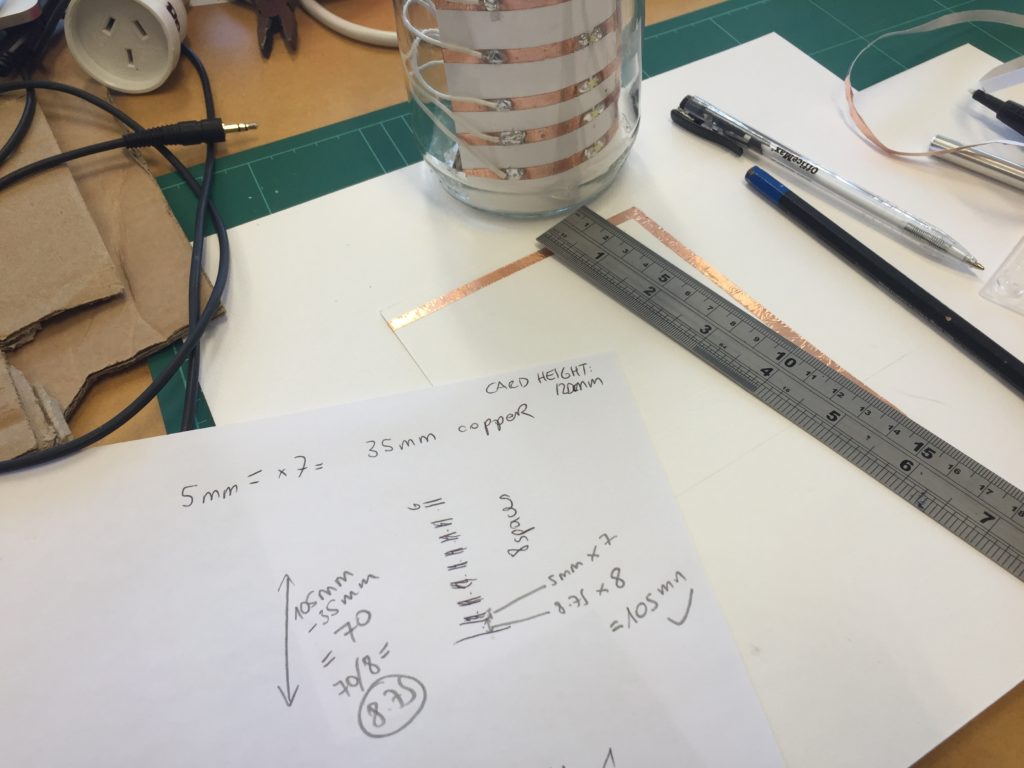
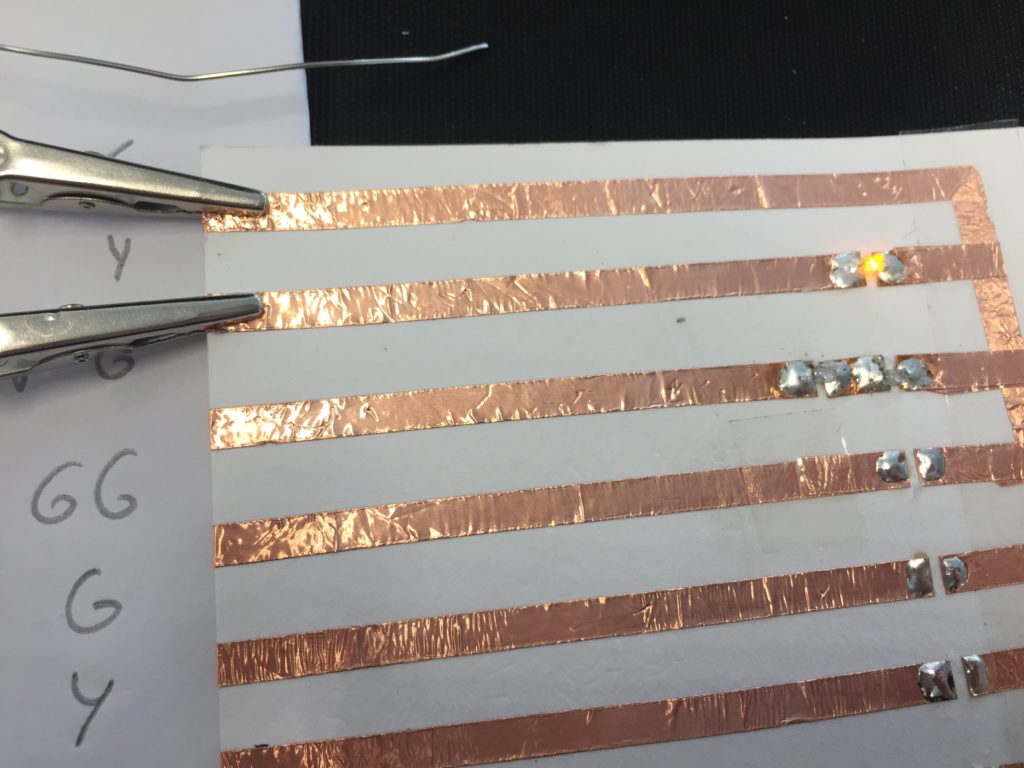
To accelerate the development, I aim to build simple straight copper trails first as a proof of concept instead of spending time on developing a unique visual aesthetic for the circuit design without knowing whether the general concept works. I use the same circuit design as for the LED jar, but I need to recalculate the spacing for this version to fit eight rows of copper tape on the paper.
The Wemos D1 has seven digital outputs which makes it suitable for addressing seven LEDs individually. With the 8th digital output unused there is an opportunity for of adding a white LED on top later crossing all other outputs with sellotape, that could indicate the status of the network, similar to the EC jar.
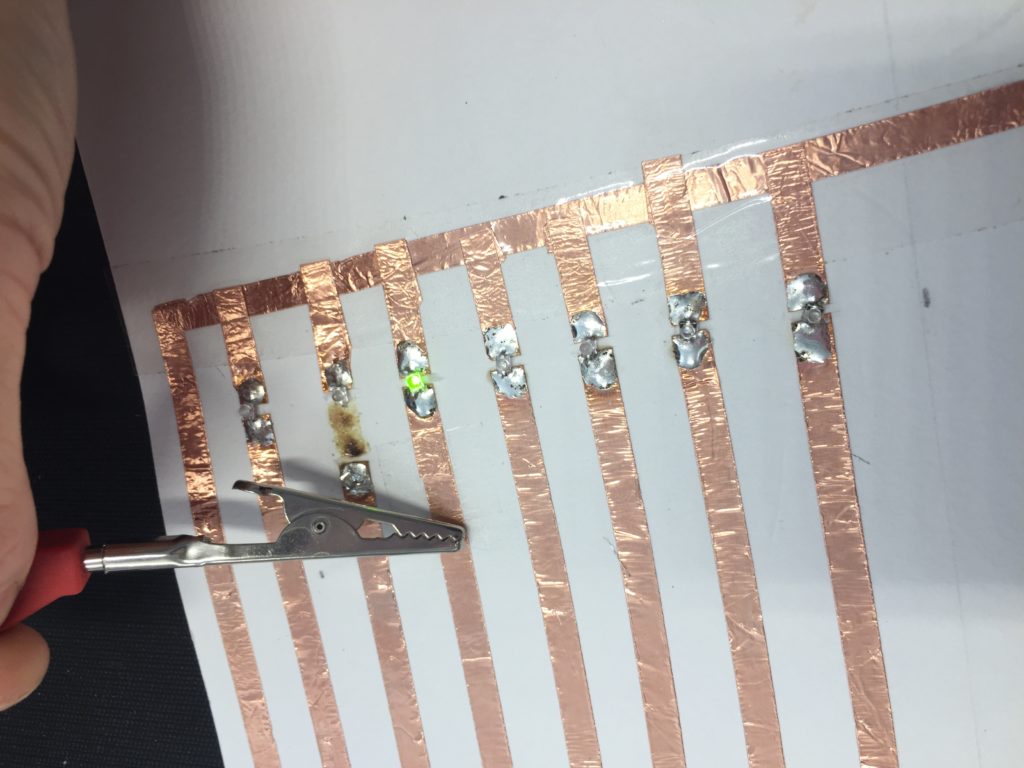
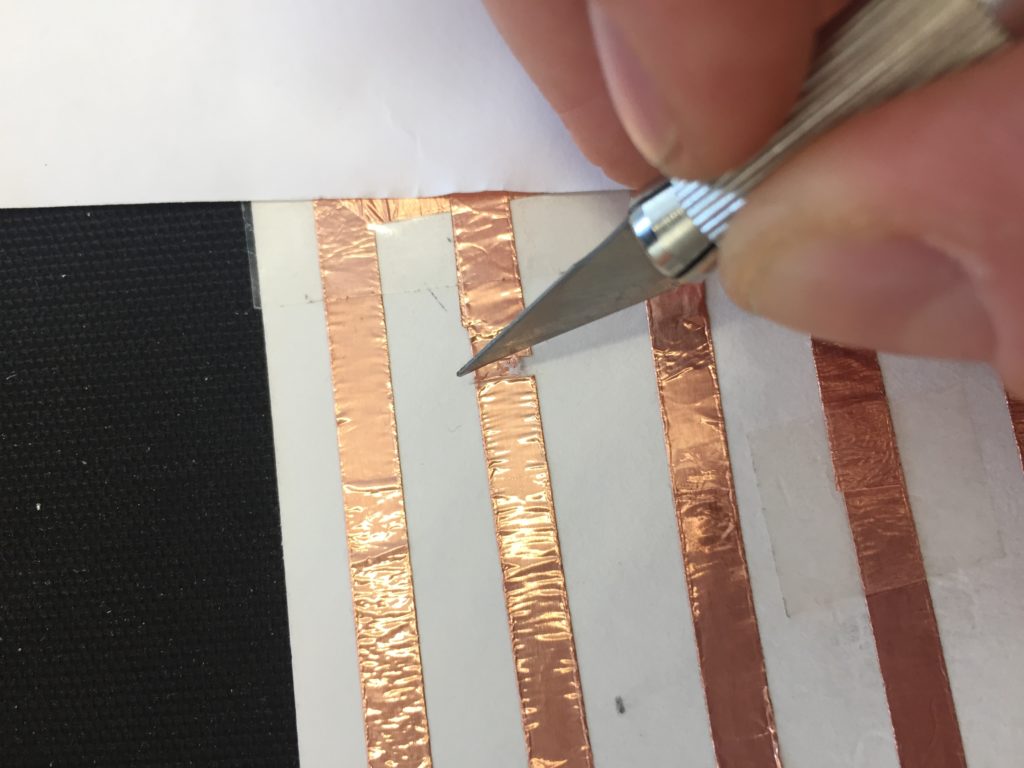
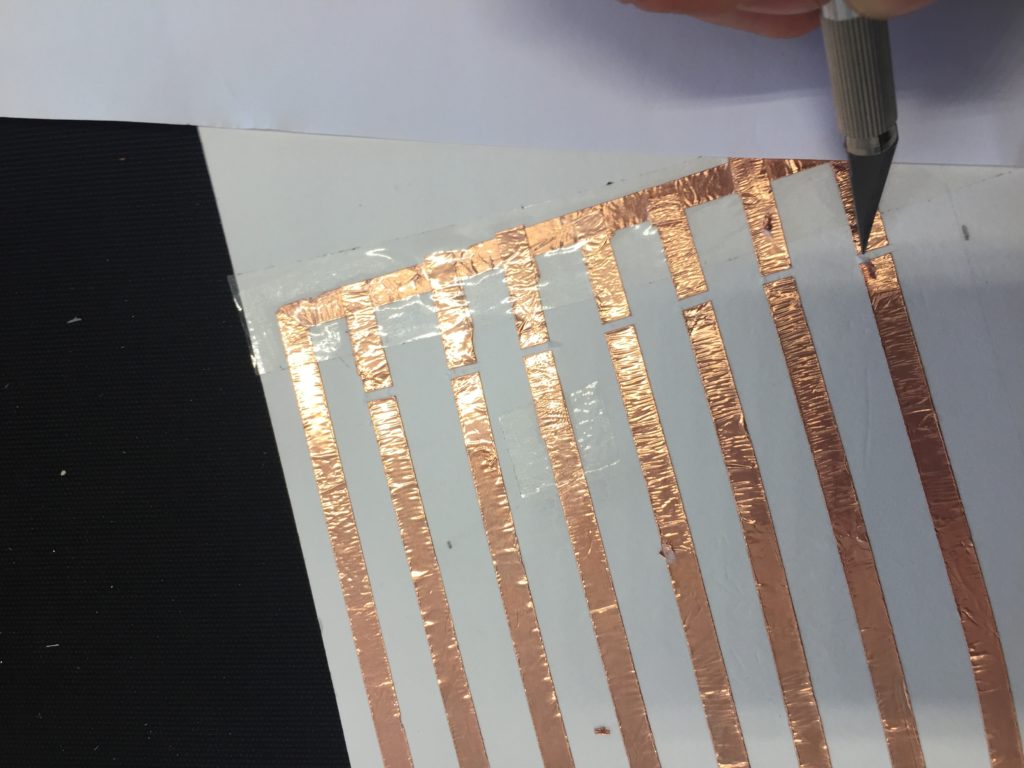
The biggest challenge when making circuits with copper tape is the needs careful treatment and patience to make sure connections don’t break.
I use a craft knife to make precise cuts where the LEDs will be soldered in later.
I align the LEDs on the page so that the output can be seen best from one single perspective, that should later face towards an accessible area by the stream.
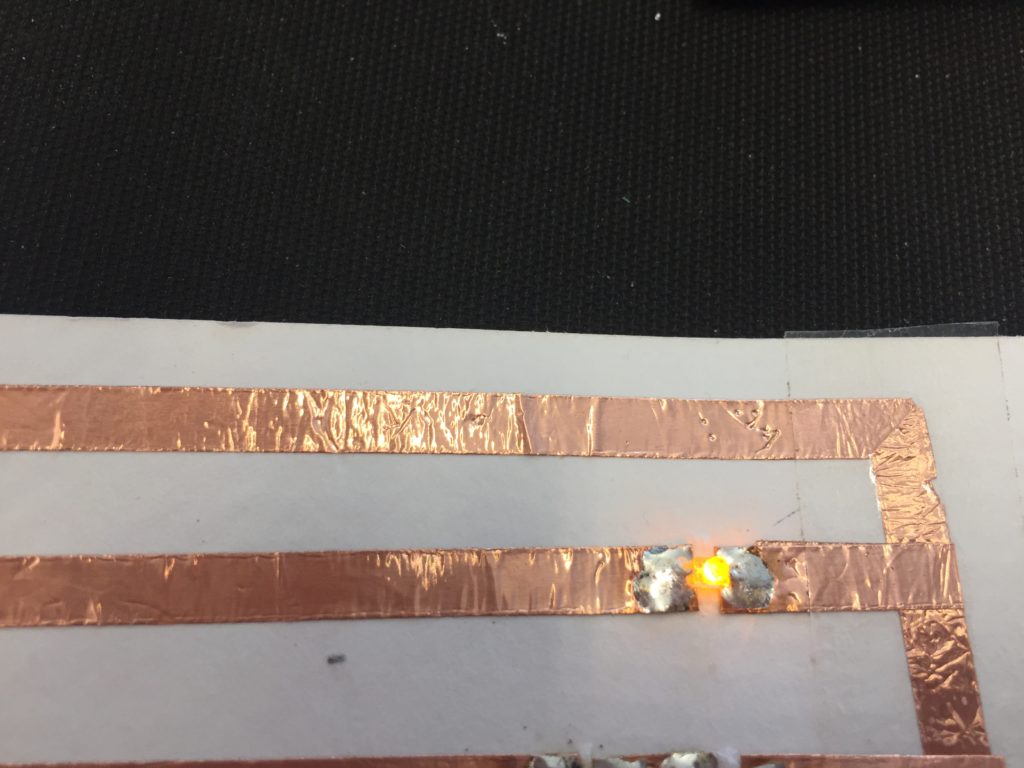
After all the LEDs are soldered into the circuit I test the quality of my solder points with a voltmeter.
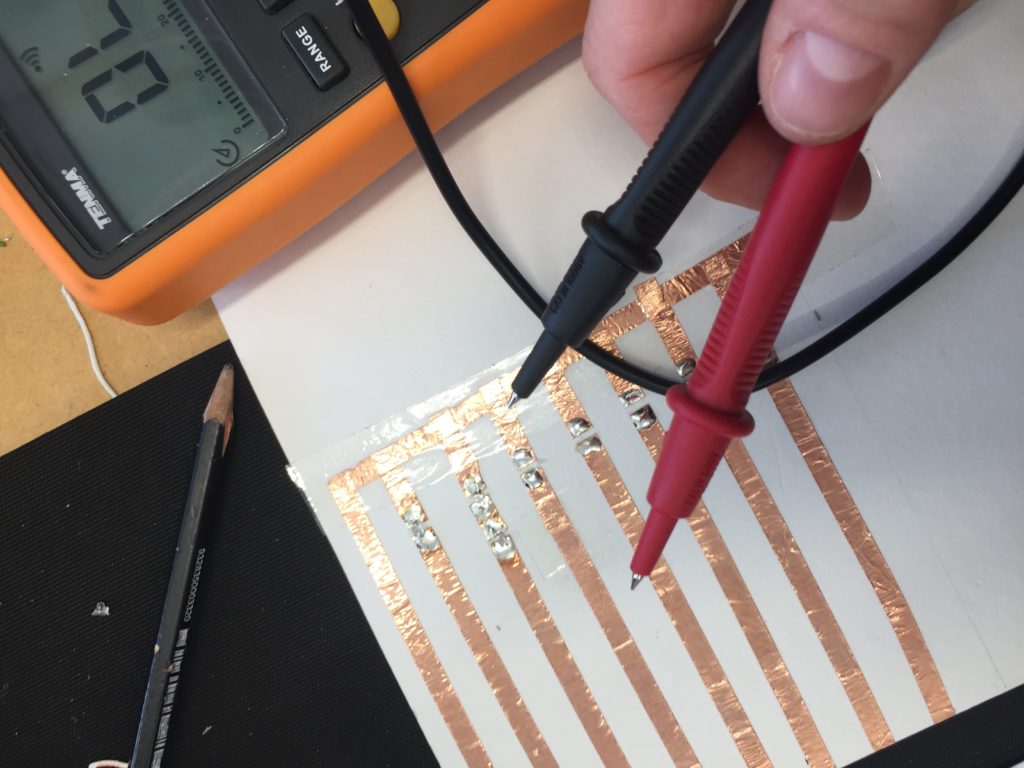
Then I manually apply the forward voltage of each LED separately to test whether the connections work up until the edge of my circuit, where I will later add the connections to the microcontroller.
Challenges, reflections and learning outcomes
When working with SMD LEDs, I encountered the following issues:
- The LEDs are tiny and their polarity is barely visible from the top. Sometimes LEDs move during soldering or don’t connect properly. I need to make sure I don’t accidentally move or flip them when working on the circuit touching the circuit with my hands or the tip of my soldering iron.
- The LEDs that I am using have a clear lens. I need to be careful to not mix up LEDs of different colours. The only way to know their colour is to power them on, which is tedious when dealing with the SMD form factor.
- Components close to each other don’t work well with copper tape. There need to be at least some centimetres of tape between two components.
In the sketch above you can see that my reference paper for the LEDs has moved in the process of adding LEDs which resulted in me picking the wrong LEDs for the first two rows. After removing the wrongly coloured LED I also realise that two green LEDs in series will not work for the “excellent” category as that would require a voltage of 2*2.2V which the microcontroller cannot supply. After making too many errors, I decided that I call it a day after testing that all the other LEDs work and will continue lab development after a healthy amount of sleep.