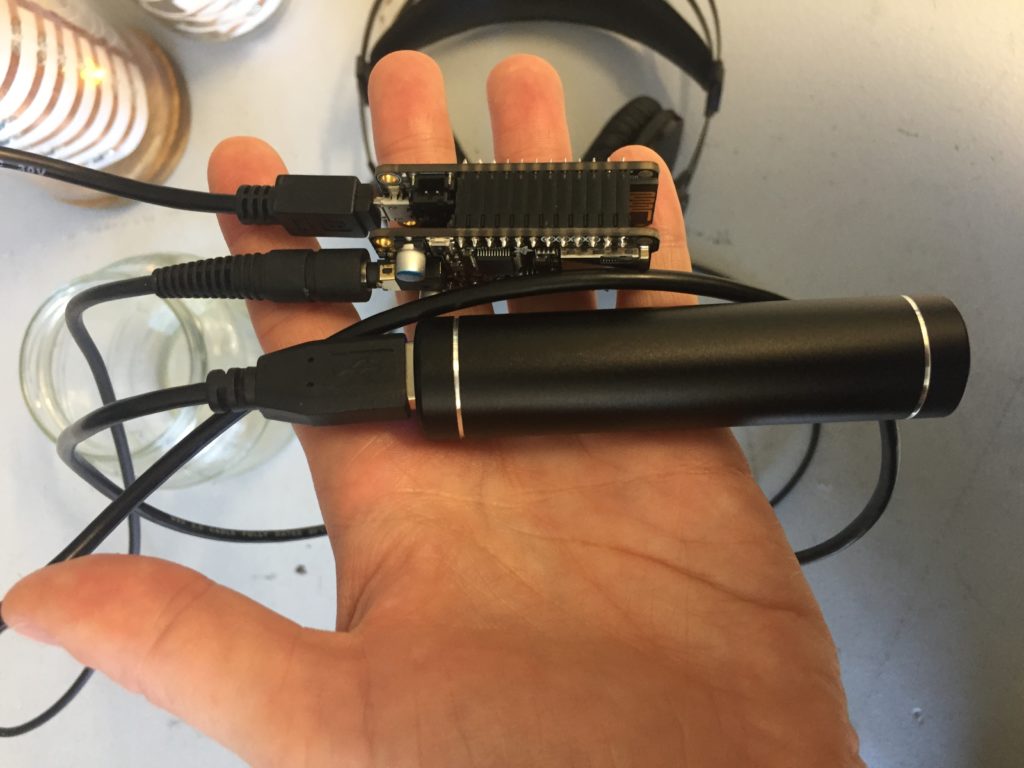
Several participants in my design evaluation interviews indicated the interest in having audio as a medium to access the stream sensor data. As a result of this, I looked at options to use the ESP8266 chip in combination with a simple audio interface. I found some research on using the Wemos D1 for sound applications, a previously purchased microcontroller, the Adafruit Feather Huzzah can be expanded with the Music Maker FeatherWing, which adds an audio interface with a headphone jack output which could be used as a standalone version in the field.
Setting up the Adafruit Feather Huzzah
The Feather requires you to install a USB-driver (USB to UART Bridge VCP drivers) to work with your operating system properly. Note: For this install you need to restart your computer.
The Huzzah is part of the ESP8266 board manager, which needs to be added to the Arduino IDE under via Arduino…Preferences…Additional Board Manager URLs…
If step one and two have been successful, the Feather should be ready to be programmed with the Arduino IDE.
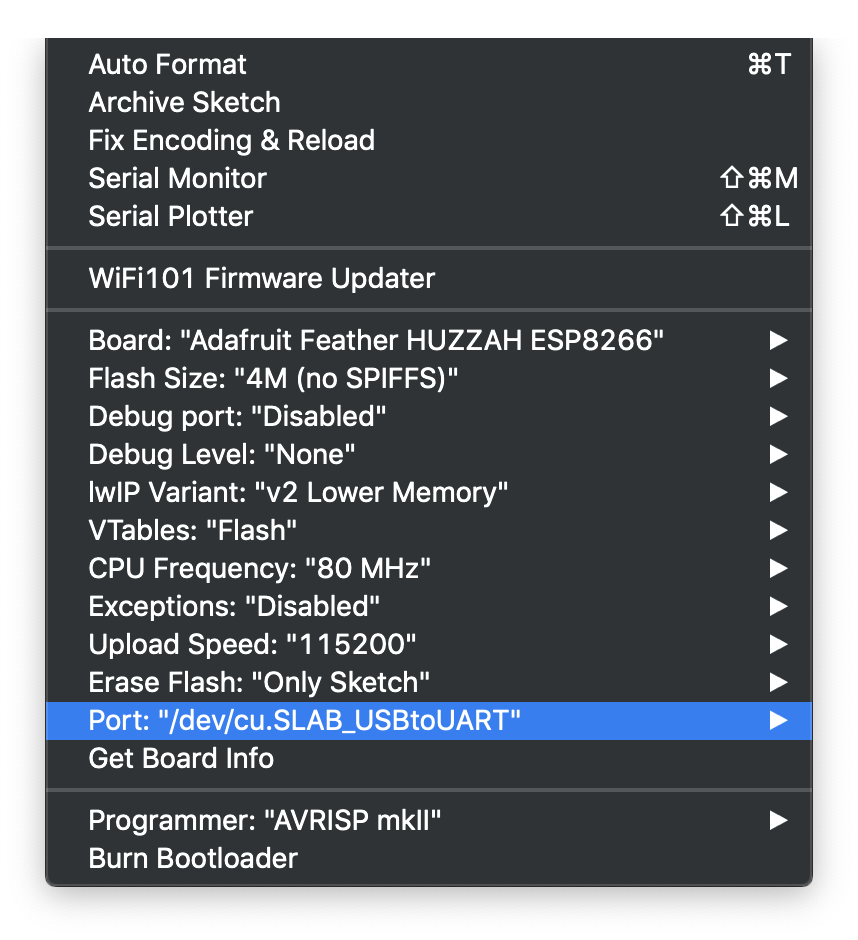
Arduino…Tools menu showing correct Board and Port to work with the Feather
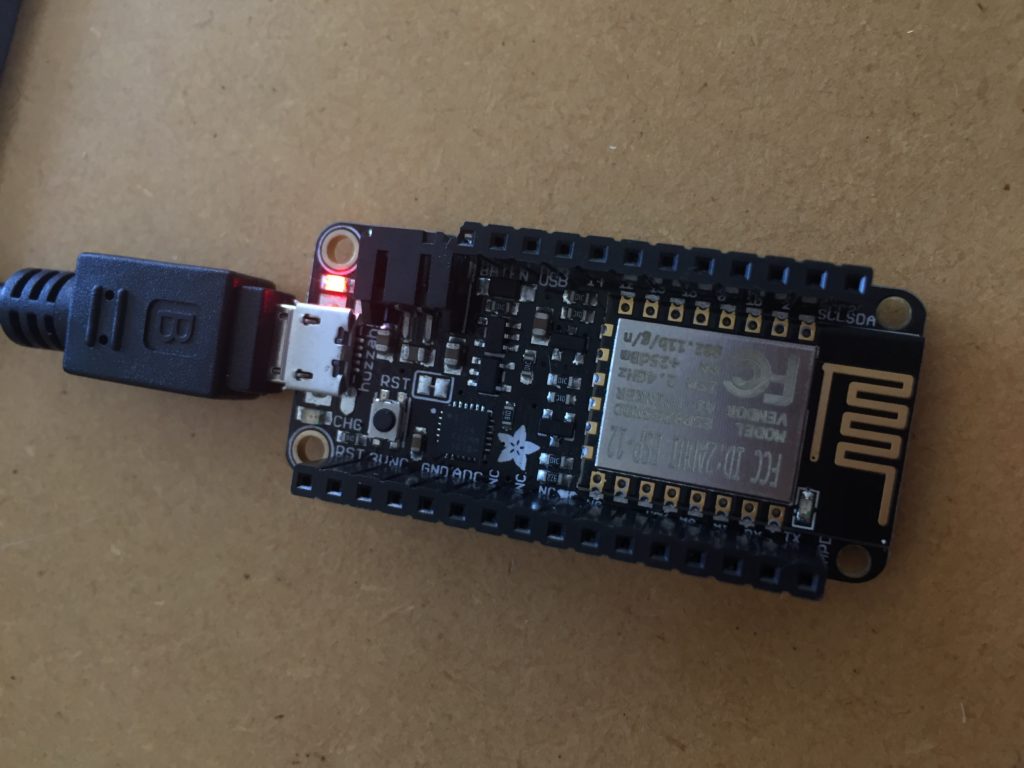
Success. The Blink sketch is running smoothly on my Feather.
Feather Huzzah running the Blink script
Equipment Cost
I have ordered the Feather ordered at an earlier stage of the research project, but decided in the and not to chose it as the chosen as a central component of my project, mainly because of the price point (currently $33.00pp vs Wemos D1 $10.00pp on nicegear).
The Musicmaker shield adds another $36.00 to the sum.
For a complete audio player setup, an SD card (to store the mp3 files) and headphones are required. The MIDI setup does not require the SD card.
Adding the Audio Shield
Once the Musicmaker arrives I need to install some software as described in the guide by lady ada (2018):
Install the library for the Adafruit VS1053 Codec Breakout (lady ada, p.13).
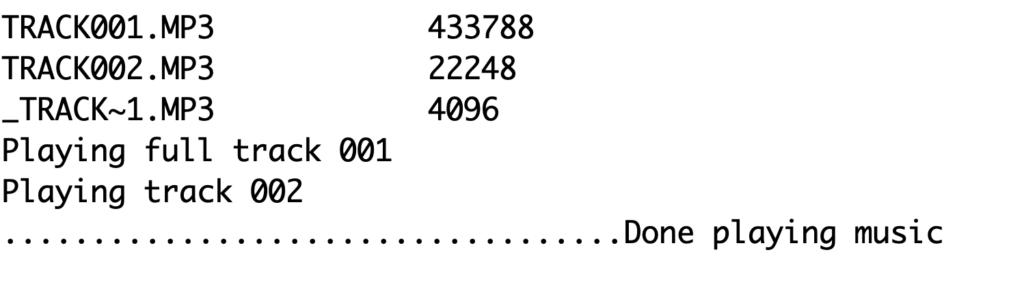
Test the example code feather_player with two mp3 files on the SD card.
Solder the MIDI jumper on the bottom of the board together and test the MIDI example.
So far so good.
Now I need to connect the Feather to my MQTT network and have audio play triggered by a callback.
After some fiddling with the code, I manage to play the test Ocarina scale from the example code when the EC sensor and the water temperature sensor transmit data across the network.
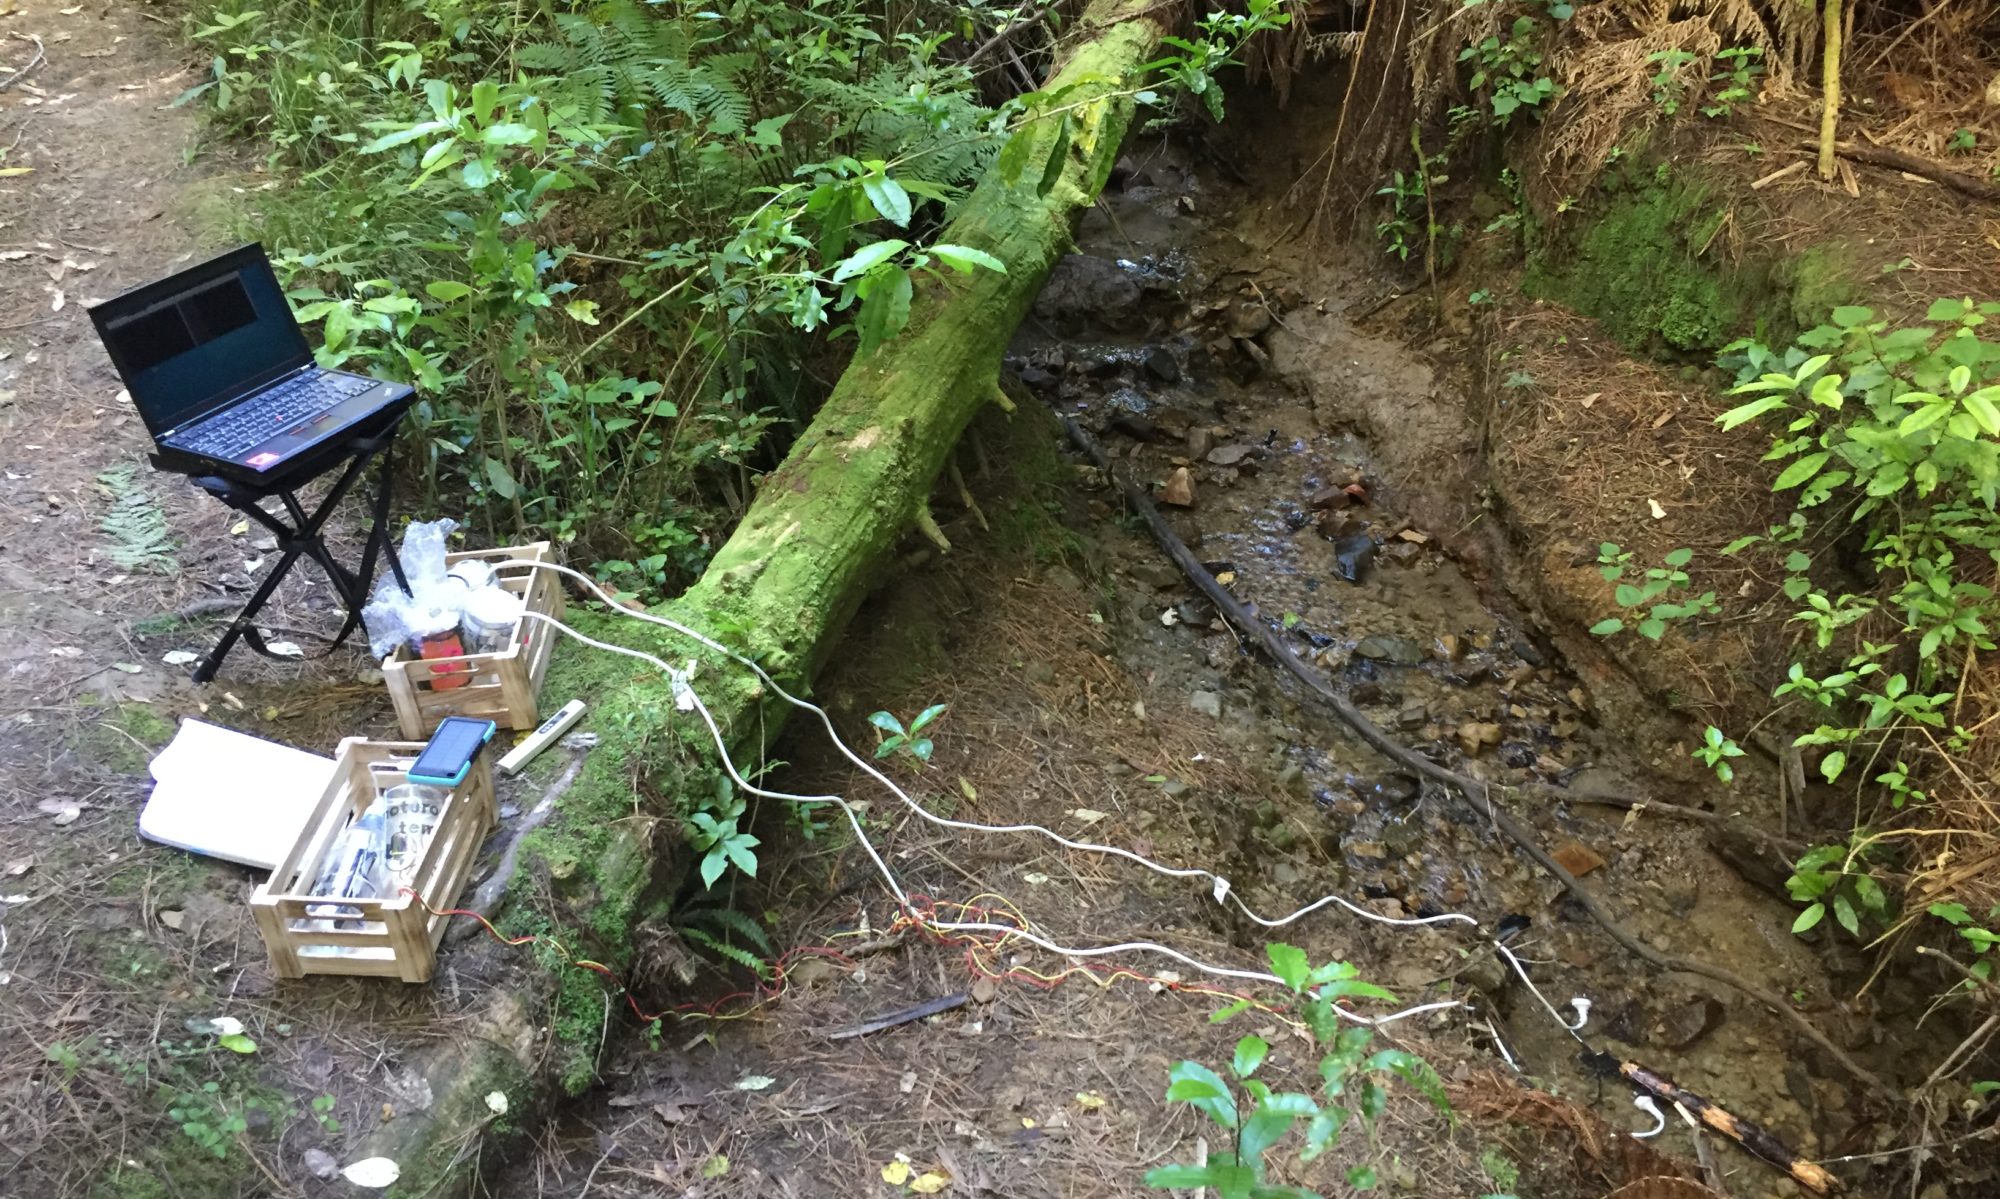
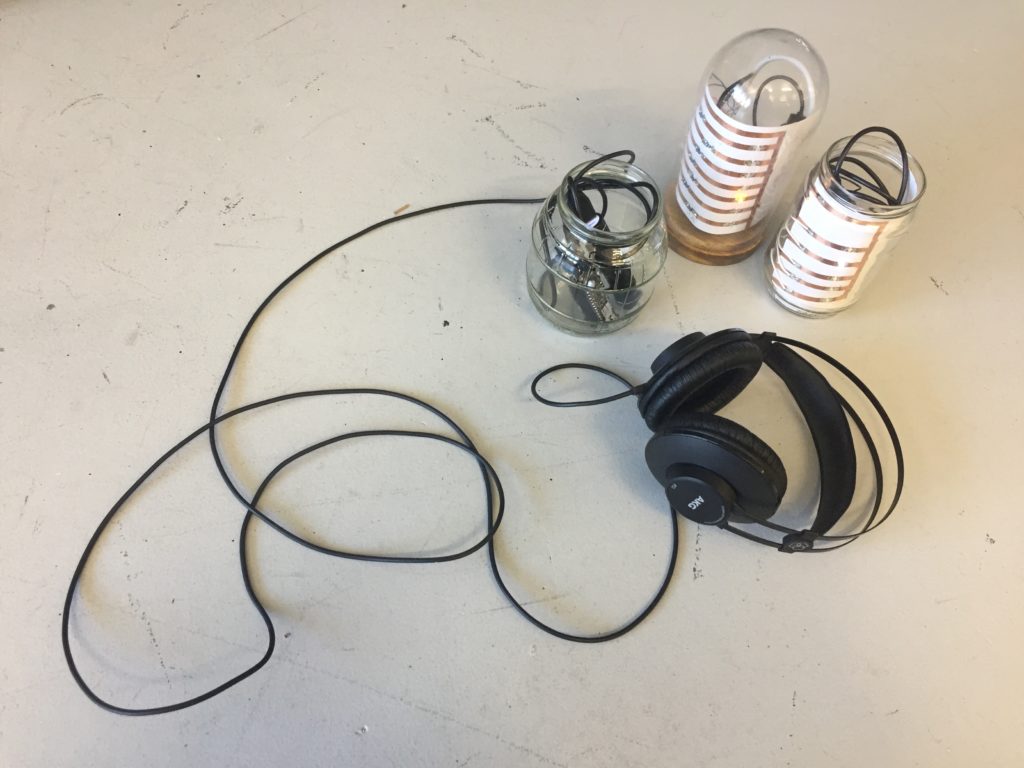
The audio jar stands now among two visual outputs. While it offers a different mode of access to the stream data, it also breaks with the convention of having one-on-one relationships between input and output nodes.
I also need to consider if the jar casing is the best choice for this node, and how an audience would access the data in the field. The node could be a hidden audio jack that participants can plug their headphones into, or headphones can be provided. Alternatively, I could use a small speaker to play the sound output and make the experience accessible to multiple users at the same time.
The opportunities for this extra node need to be tested and evaluated in the field.
My DIY water sensor nodes need field-compatible outputs so that visitors can easily access and understand the sensor data of the IoT network in real-time. The design for the temperature visualisation is based on the concept of the previous paper circuit for the EC probe, because research participants generally gave the design with cardboard, copper tape and white LEDs positive feedback. For the water temperature jar, however, I am using coloured LEDs, as suggested by one participant. In my development notes below, you can learn how I designed and assembled the device, and how the SHMAK manual (NIWA, 2008) helped to make the visual output meaningful. The idea for using cardboard and copper tape for these prototypes is inspired by the work by Jie Qi (2012) and the High-Low Tech Group at MIT Media Lab (2012).
Development Notes
Similar to the previous LED prototype I use a 12cm high sheet of white card paper as a base for my copper tape trails. During an evaluation discussion on the EC jar design, participant 18 suggested the use of coloured LEDs for future iterations. I am attempting to implement this suggestion in the design for the jar that visualises the data coming from the water temperature sensor (DS18B20).
Evaluating the EC jar design with research participant in the lab (Jan 2019)
Visualising stream wellbeing
During the ideation phase, I focused on a suitable way to connect coloured lights meaningfully to the water temperature readouts. Hence, instead of opting for a traditional water temperature colour scale for blue (cold) and red (warm) I departed from the perspective of the stream, and what effect water temperature has on the more-than-human wellbeing of the stream.
Water temperature
Water temperature
Stream temperature is important because every species has a preferred temperature range. The range varies considerably from species to species. Sometimes, a temperature change is important, for example, as a trigger for egg hatching in some mayflies. Many organisms are unable to survive in temperatures above about 30 °C (except for some adapted to life in hot springs). At the other end of the scale, temperatures below freezing point constitute a very harsh environment because of the effects of ice.
A single temperature measurement is not particularly informative, but a series over time will provide a rough picture of the temperature regime in a stream. The longer the series and the closer together the measurements, the more informative the series will be.
Temperature depends largely on time of year and weather conditions. Stream type also plays a part. For example, lowland streams tend to experience quite stable temperatures (i.e., closely following average air temperatures). Shading along streams reduces the occurrence of extremely high water temperatures.
Water temperature fluctuates on a daily basis and for this reason it is suggested that measurements are always conducted at the same time of day.
Less than 5 Rating: fair Score: 5
Less than 5°C
Values below 5 ºC are low and indicative of winter conditions in southern regions. Invertebrate and periphyton growth would be slow in such waters. Some species may be excluded.
5 to 9.9 Rating: good Score: 8
5 to 9.9°C
Values of 5 to 10°C are moderate to low and indicative of winter conditions. Most invertebrates and periphyton can survive well in these temperatures.
10 to 14.9 Rating: excellent Score: 10
10 to 14.9 °C
Values of 10 to 15°C are very suitable for most invertebrates and periphyton.
15 to 19.9 Rating: good Score: 5
15 to 19.9°C
Temperatures of 15 to 20°C will start to be stressful for some invertebrates (e.g., stoneflies).
20 to 24.9 Rating: fair Score: 5
20 to 24.9 °C
Temperatures of 20 to 25°C are moderately high. Some invertebrates, such as some mayflies, stoneflies, and some fish, such as trout, are unlikely to survive such conditions for prolonged periods (e.g., several weeks).
25 to 29.9 Rating: poor Score: 0
25 to 29.9 °C
Temperatures between 25 and 30°C are likely to be stressful to fish, stoneflies, mayflies and some caddis flies. Such high temperatures may be a result of lack of shading and very sluggish flows.
30°C or more Rating: poor Score: -5
30 °C or more
Temperatures over 30°C are likely to be very stressful to most stream life and result in their death. Again, such high temperatures may be a result of lack of shading and very sluggish flows. However, stream temperatures will rarely get to these levels.
Table 1: Habitat indicators of stream health. From NIWA (National Institute of Water and Atmospheric Research), 2008.
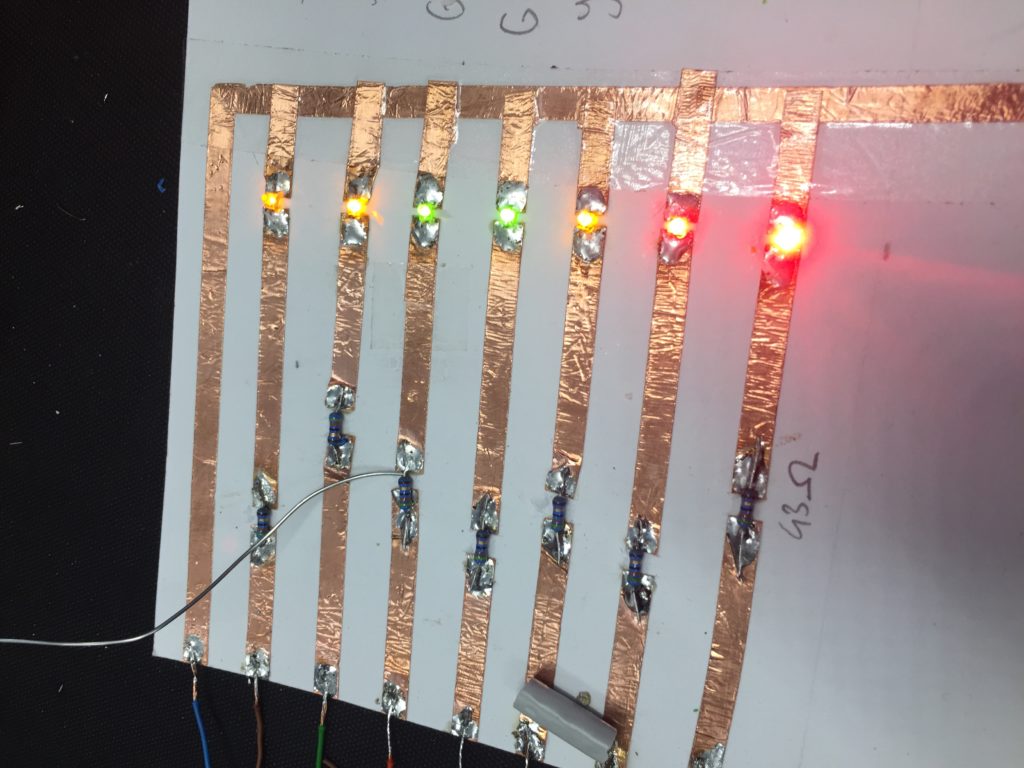
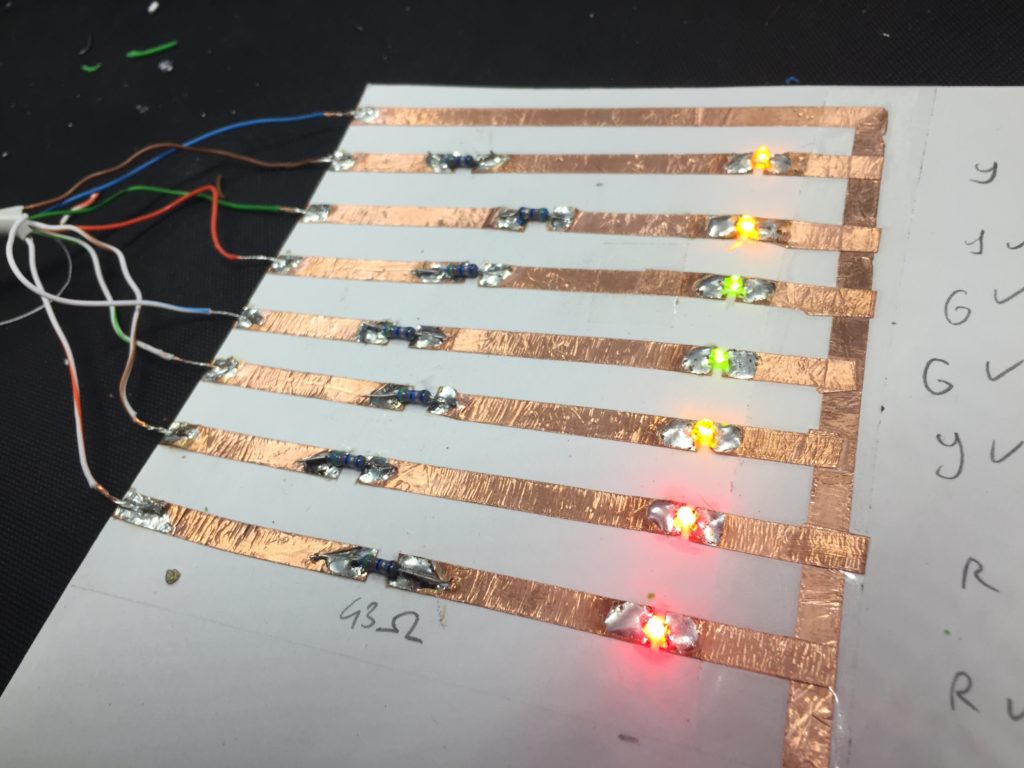
The table contains seven water temperature bands rated from poor to good. I opt to use one LED for each band, representing the ratings (poor, fair, good, excellent) with colour. I choose red, yellow and green LEDs to indicate the stream health rating:
Red
Poor
Yellow
Fair
Green
Good
Green x2
Excellent
Copper tape circuit design and assembly
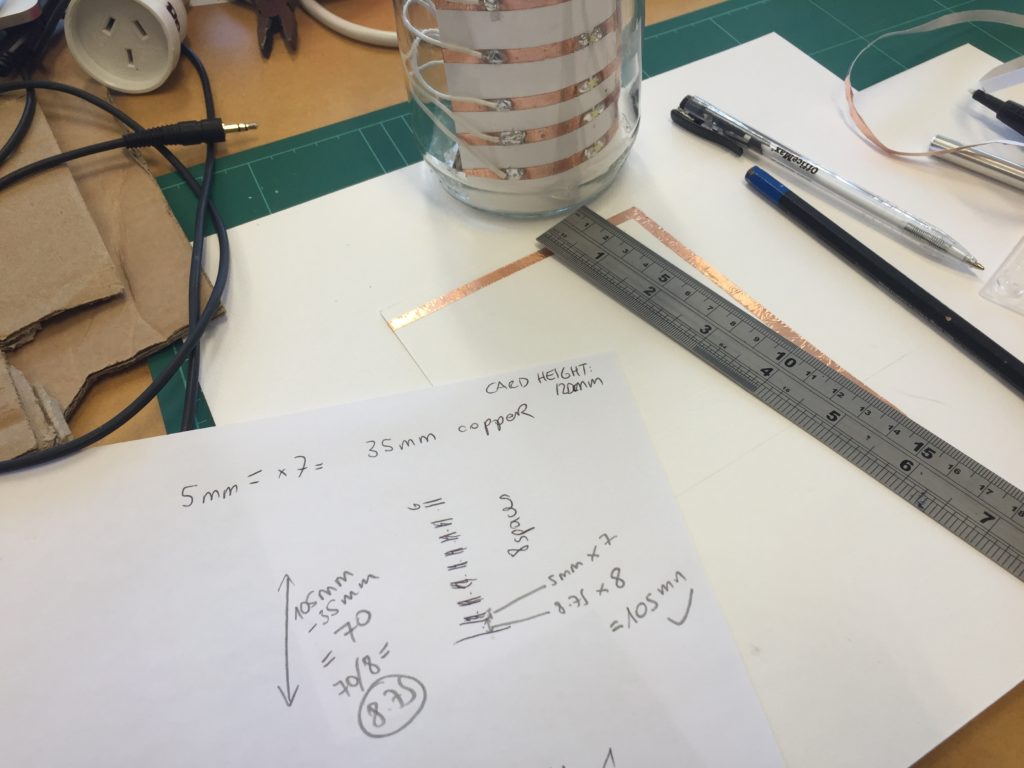
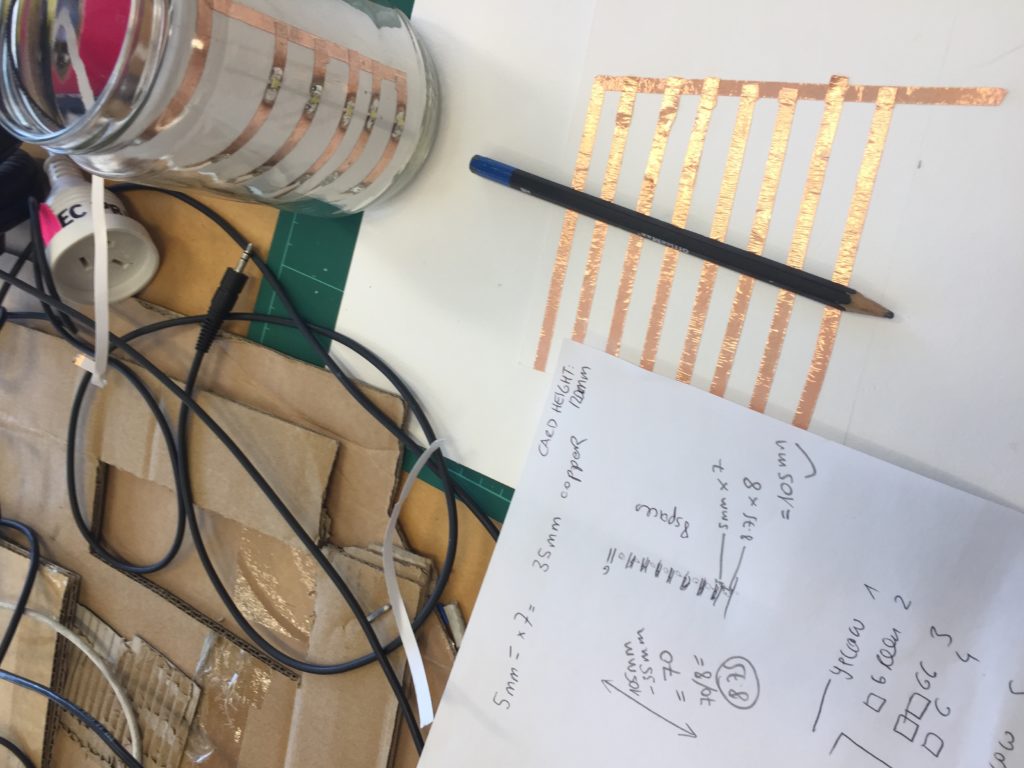
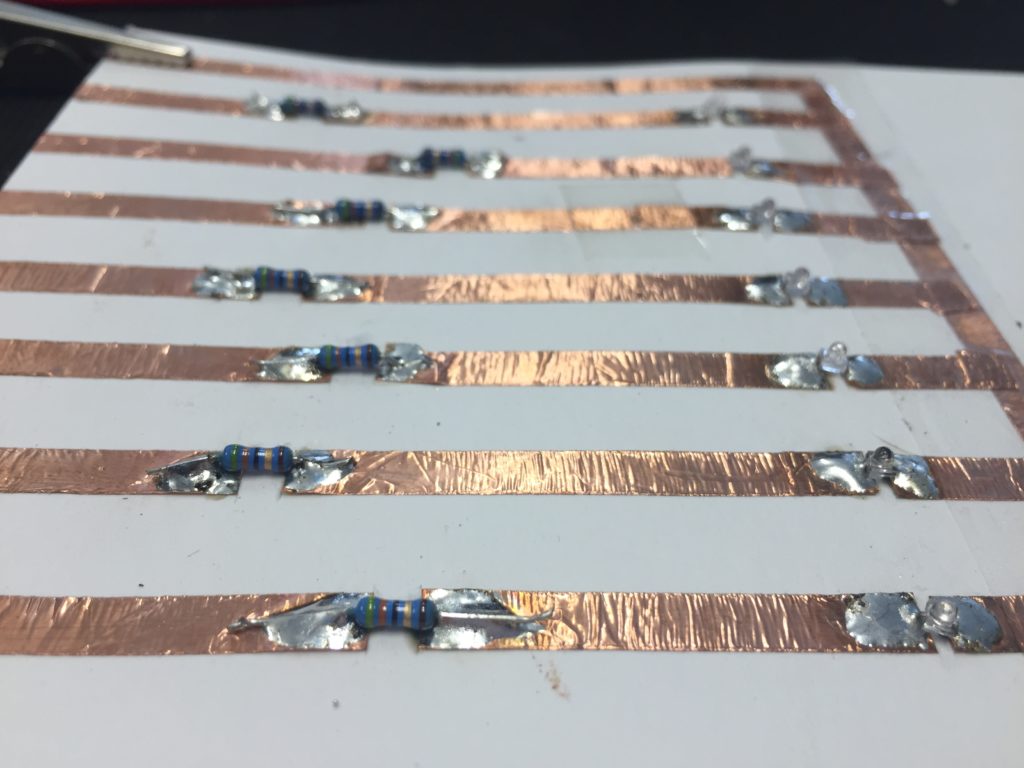
To accelerate the development, I aim to build simple straight copper trails first as a proof of concept instead of spending time on developing a unique visual aesthetic for the circuit design without knowing whether the general concept works. I use the same circuit design as for the LED jar, but I need to recalculate the spacing for this version to fit eight rows of copper tape on the paper.
The Wemos D1 has seven digital outputs which makes it suitable for addressing seven LEDs individually. With the 8th digital output unused there is an opportunity for of adding a white LED on top later crossing all other outputs with sellotape, that could indicate the status of the network, similar to the EC jar.
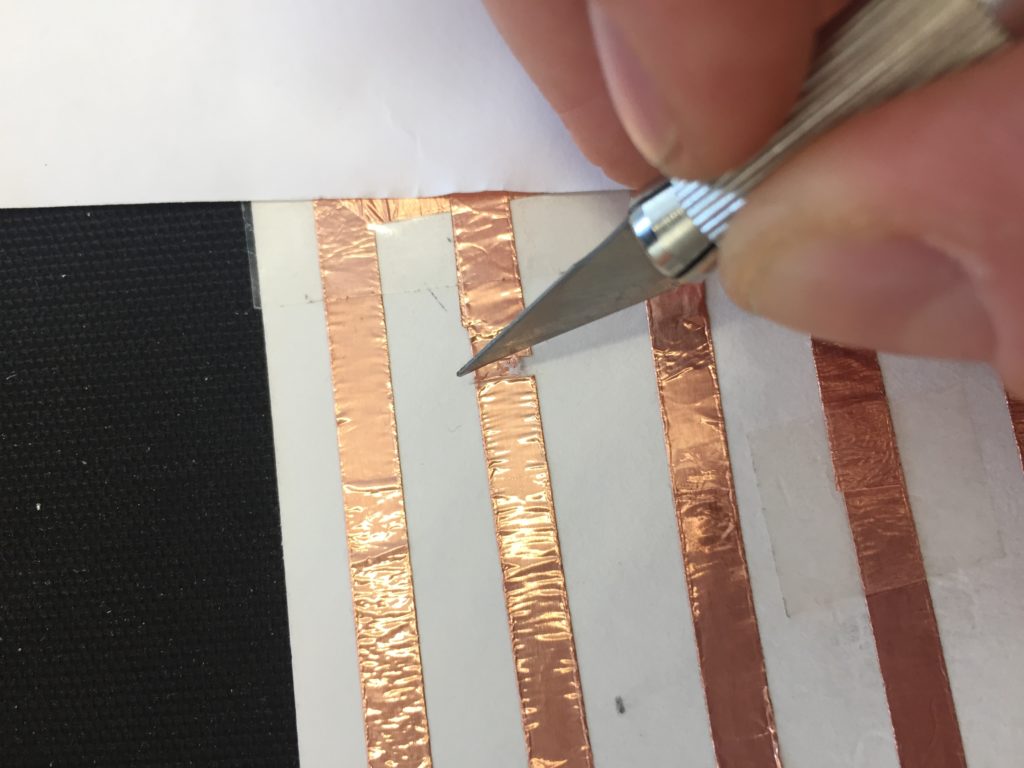
The biggest challenge when making circuits with copper tape is the needs careful treatment and patience to make sure connections don’t break.
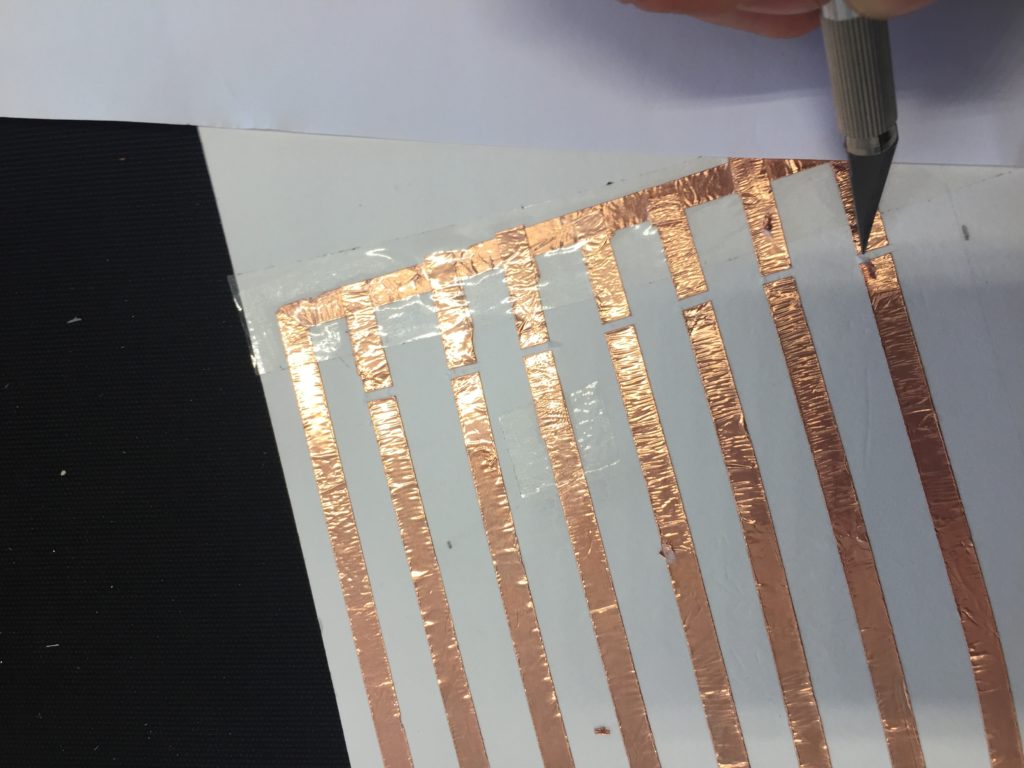
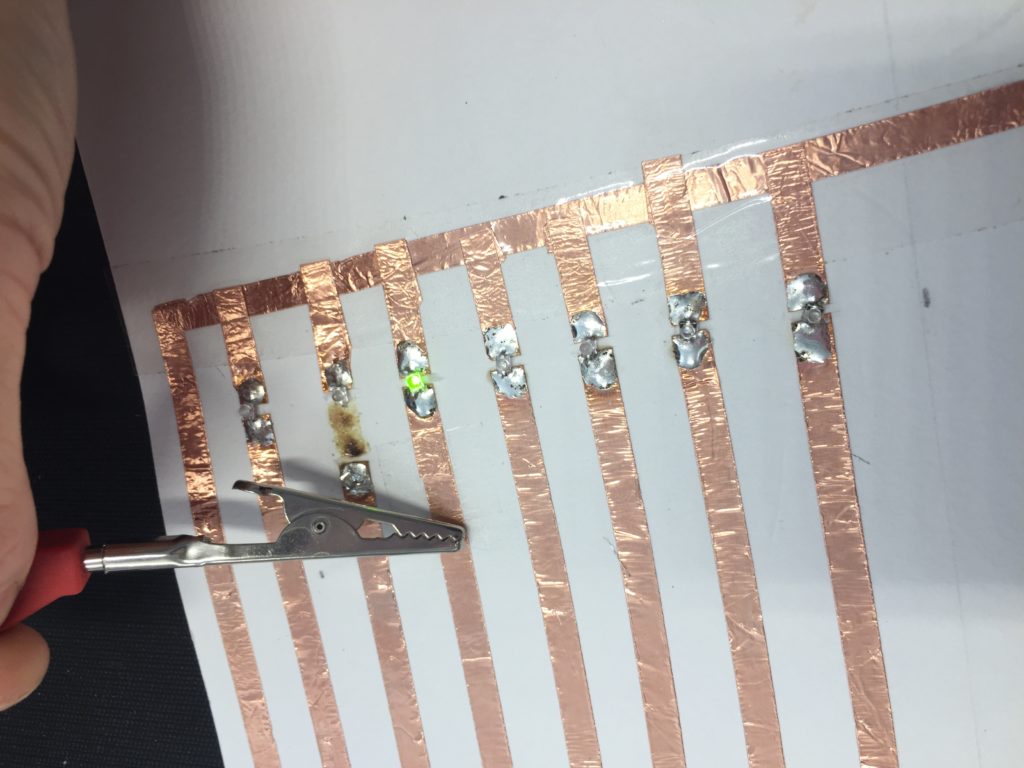
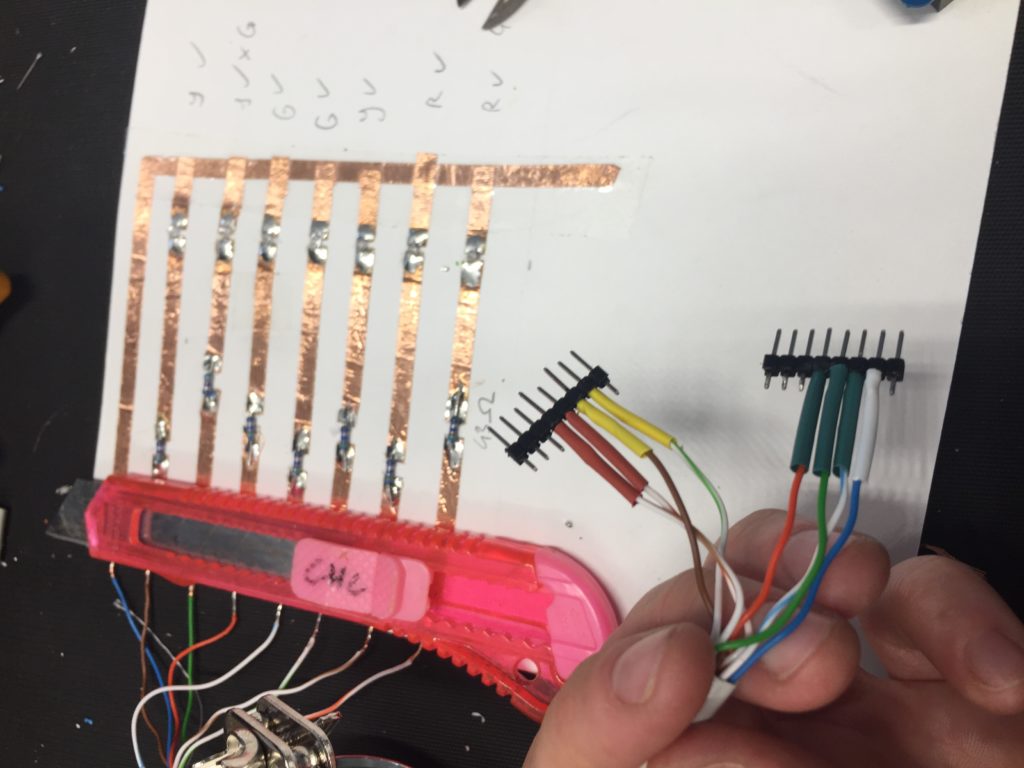
I use a craft knife to make precise cuts where the LEDs will be soldered in later.
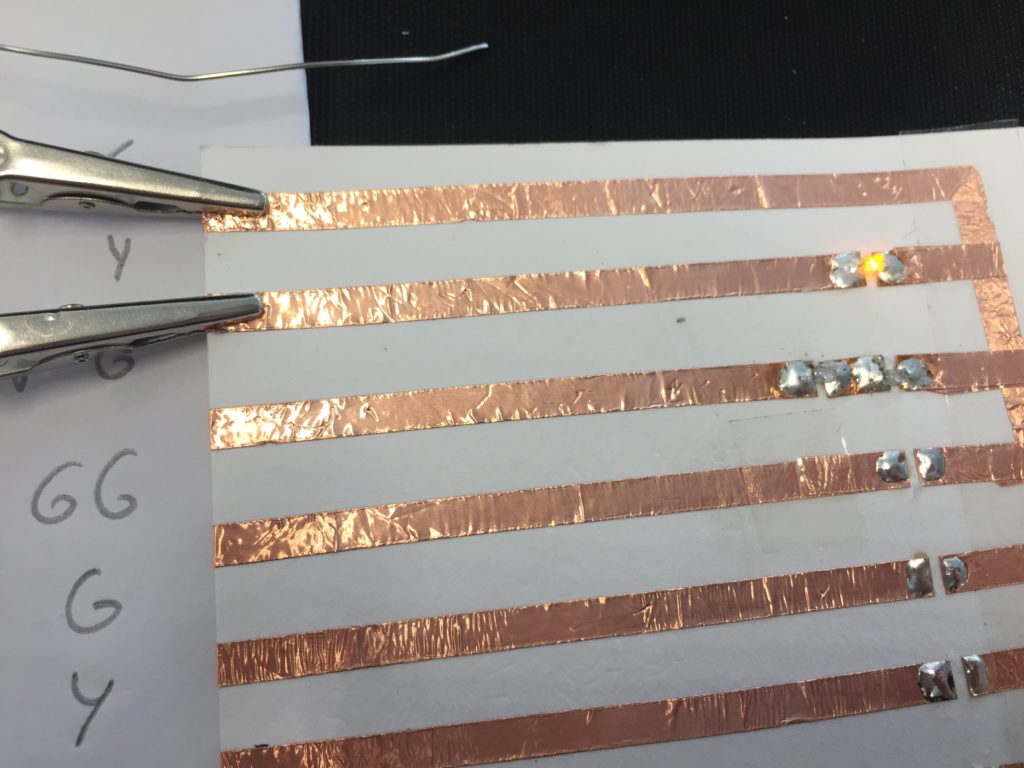
I align the LEDs on the page so that the output can be seen best from one single perspective, that should later face towards an accessible area by the stream.
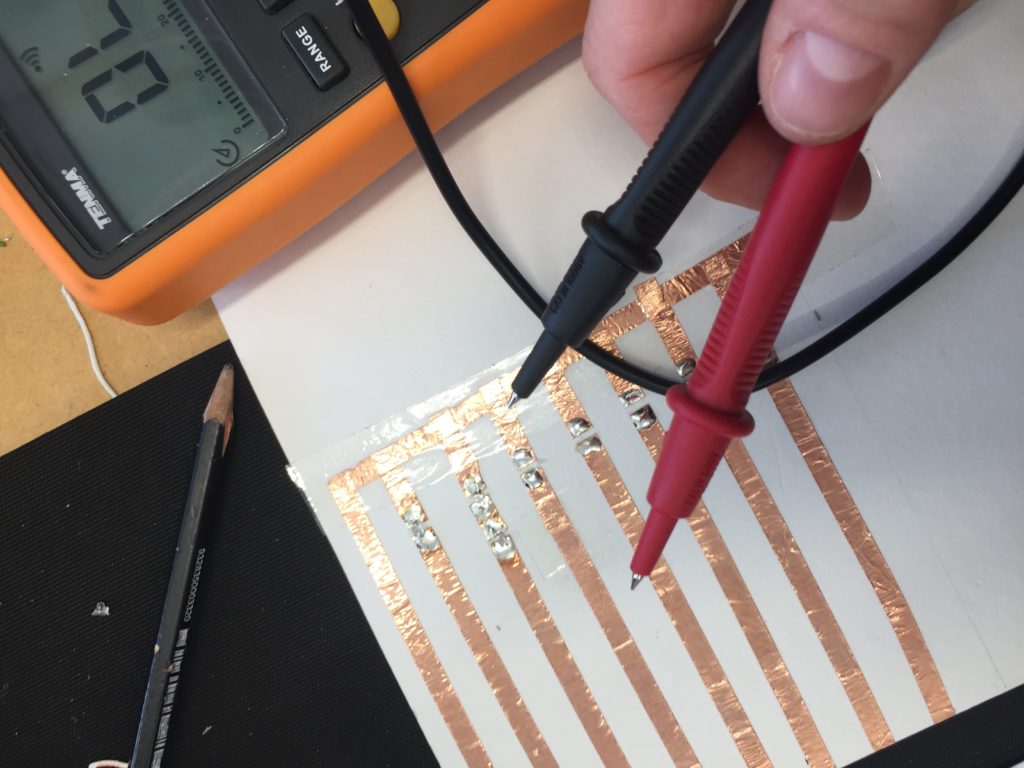
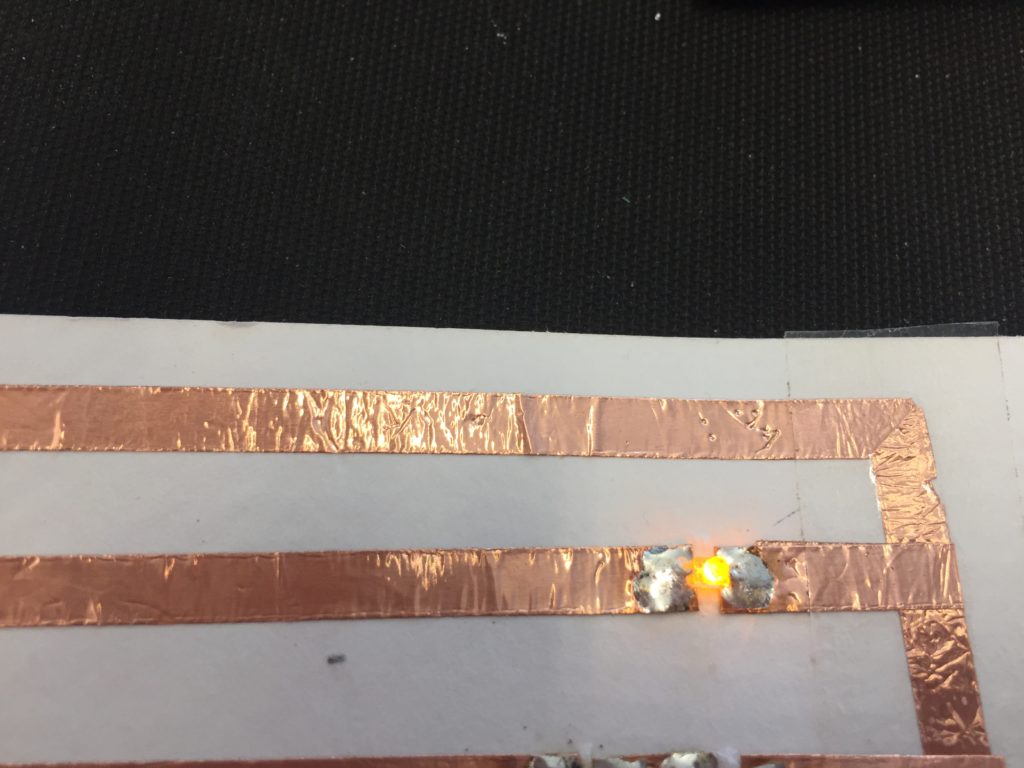
After all the LEDs are soldered into the circuit I test the quality of my solder points with a voltmeter.
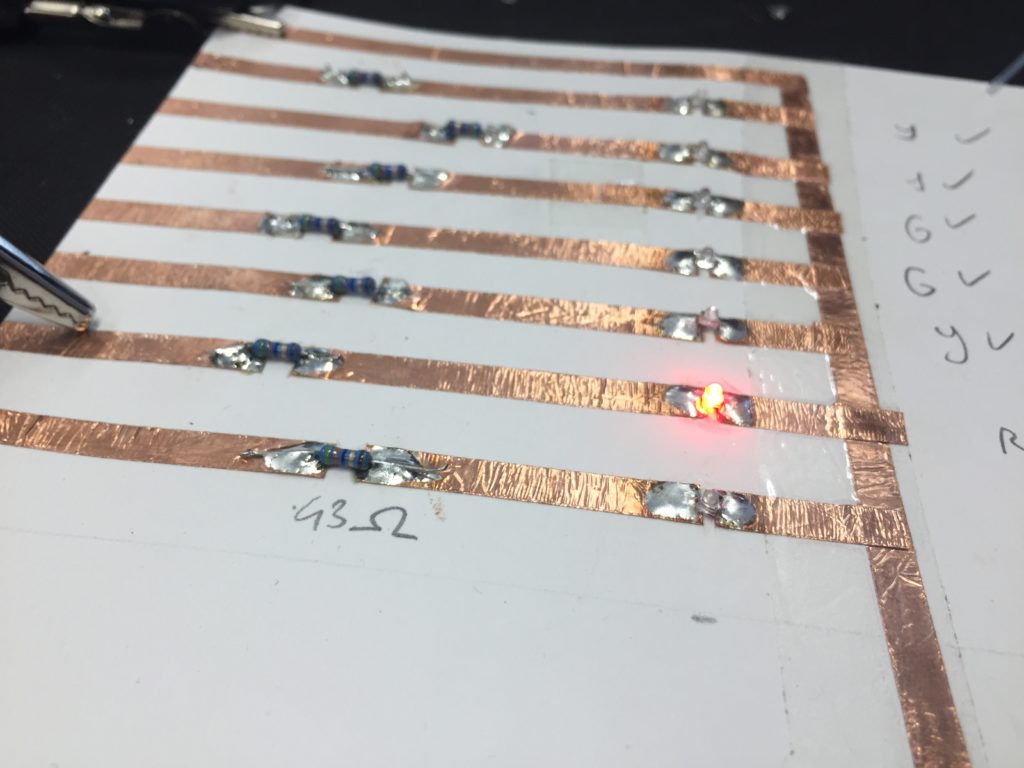
Then I manually apply the forward voltage of each LED separately to test whether the connections work up until the edge of my circuit, where I will later add the connections to the microcontroller.
Challenges, reflections and learning outcomes
When working with SMD LEDs, I encountered the following issues:
The LEDs are tiny and their polarity is barely visible from the top. Sometimes LEDs move during soldering or don’t connect properly. I need to make sure I don’t accidentally move or flip them when working on the circuit touching the circuit with my hands or the tip of my soldering iron.
The LEDs that I am using have a clear lens. I need to be careful to not mix up LEDs of different colours. The only way to know their colour is to power them on, which is tedious when dealing with the SMD form factor.
Components close to each other don’t work well with copper tape. There need to be at least some centimetres of tape between two components.
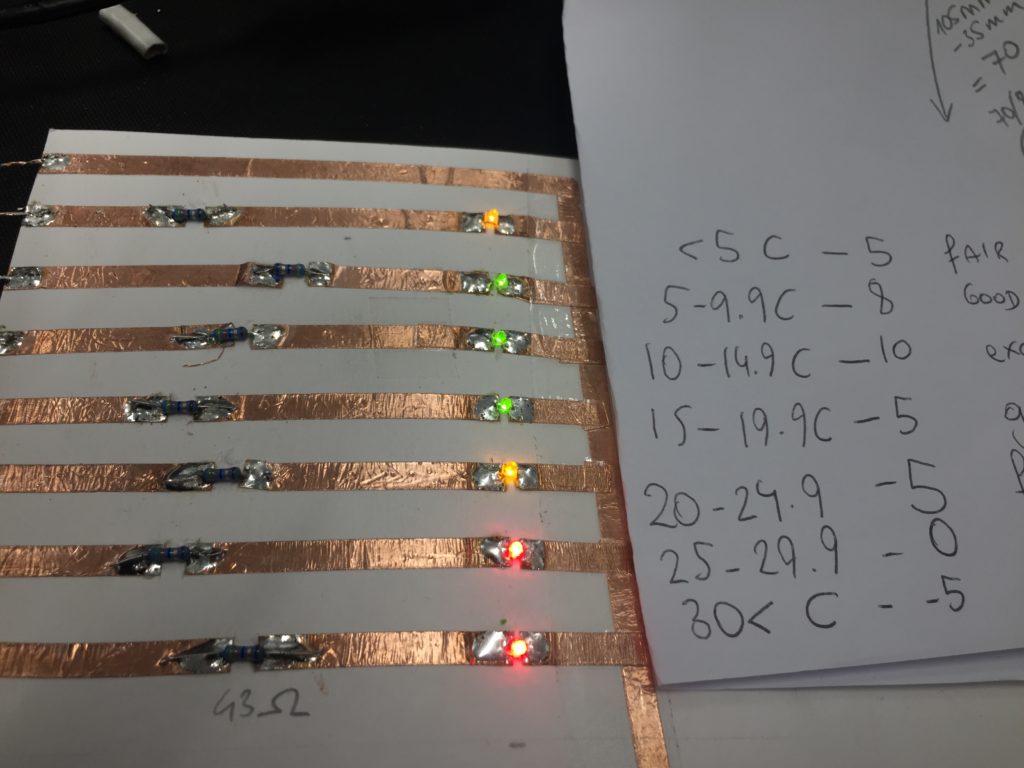
In the sketch above you can see that my reference paper for the LEDs has moved in the process of adding LEDs which resulted in me picking the wrong LEDs for the first two rows. After removing the wrongly coloured LED I also realise that two green LEDs in series will not work for the “excellent” category as that would require a voltage of 2*2.2V which the microcontroller cannot supply. After making too many errors, I decided that I call it a day after testing that all the other LEDs work and will continue lab development after a healthy amount of sleep.
References
High-Low Tech Group, MIT Media Lab. (2012, August 21). Paper circuits. Retrieved February 27, 2019, from http://highlowtech.org/?p=2505
Qi, J. (2012). The Fine Art of Electronics: Paper-based Circuits for Creative Expression (Master of Science in Media Arts and Sciences). Massachusetts Institute of Technology, Massachusetts, NE. Retrieved from http://web.mit.edu/~jieqi/Public/Jie_Qi_MS_thesis.pdf
The design for the temperature visualisation is based on the concept of the previous paper circuit for the EC probe but uses coloured LEDs that indicate the water temperature in relation to stream health, as listed in the SHMAK manual by NIWA (2008). The idea for using cardboard and copper tape for these prototypes is inspired by the work by Jie Qi (2012) and the High-Low Tech Group at MIT Media Lab (2012).
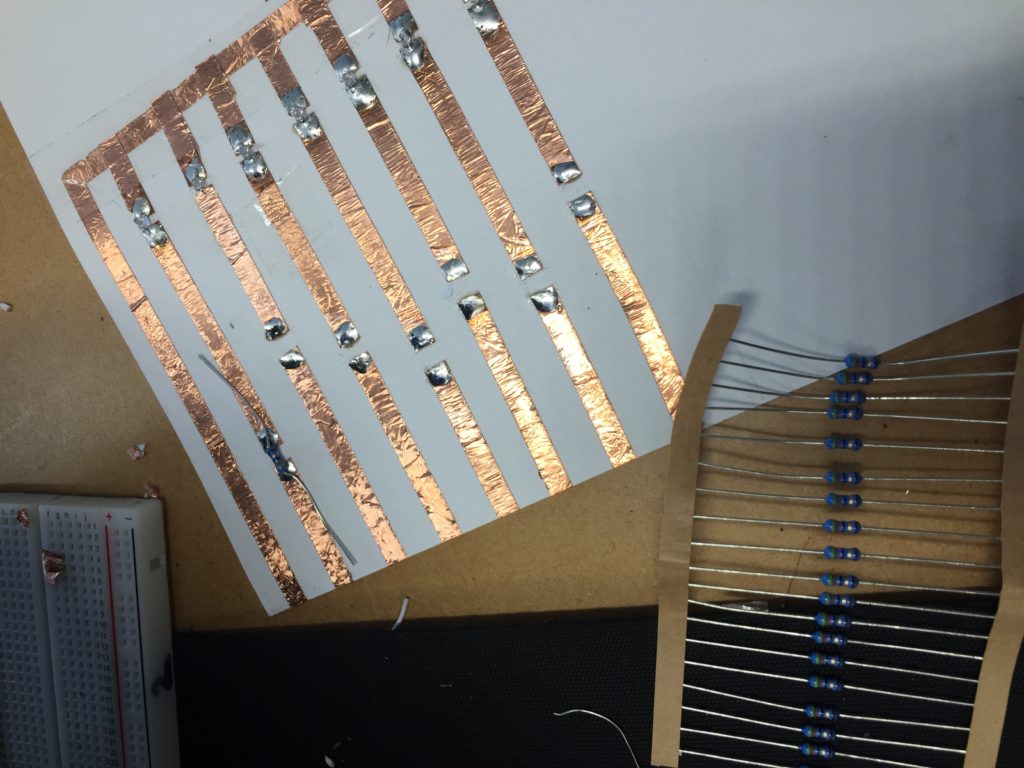
For finishing the circuit, I need to add resistors to the design as they have a smaller forward voltage than the white LEDs I used in the previous design. Using Ohm’s law, I calculated that 43 Ohm resistors are a good choice for all three colours.
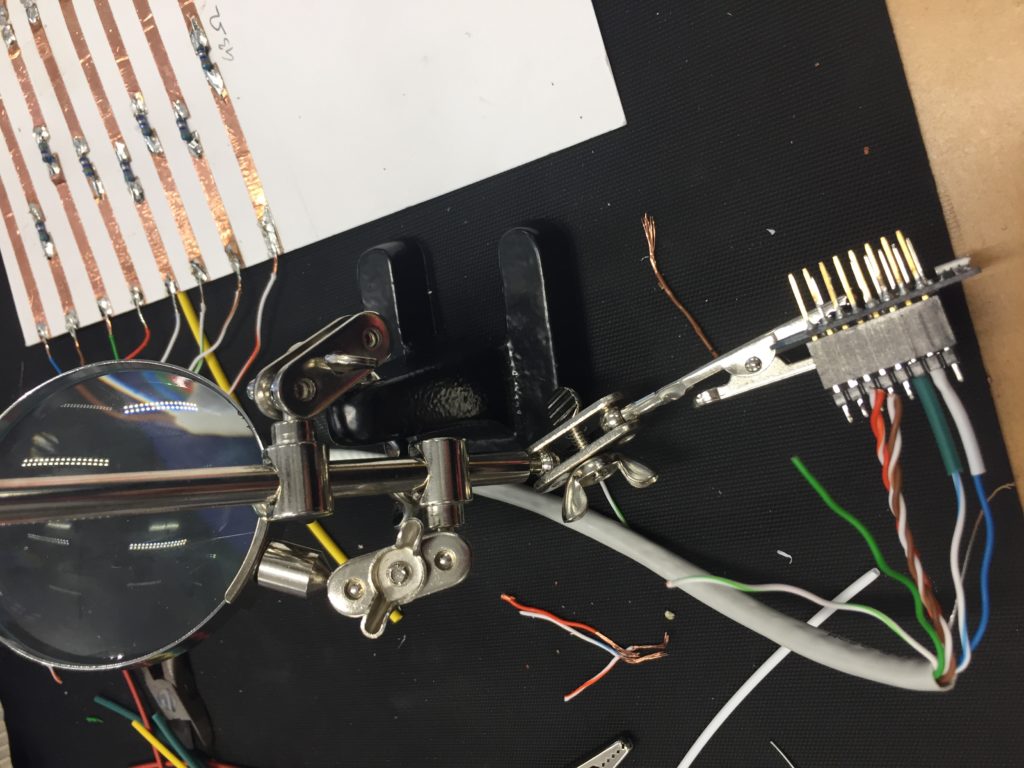
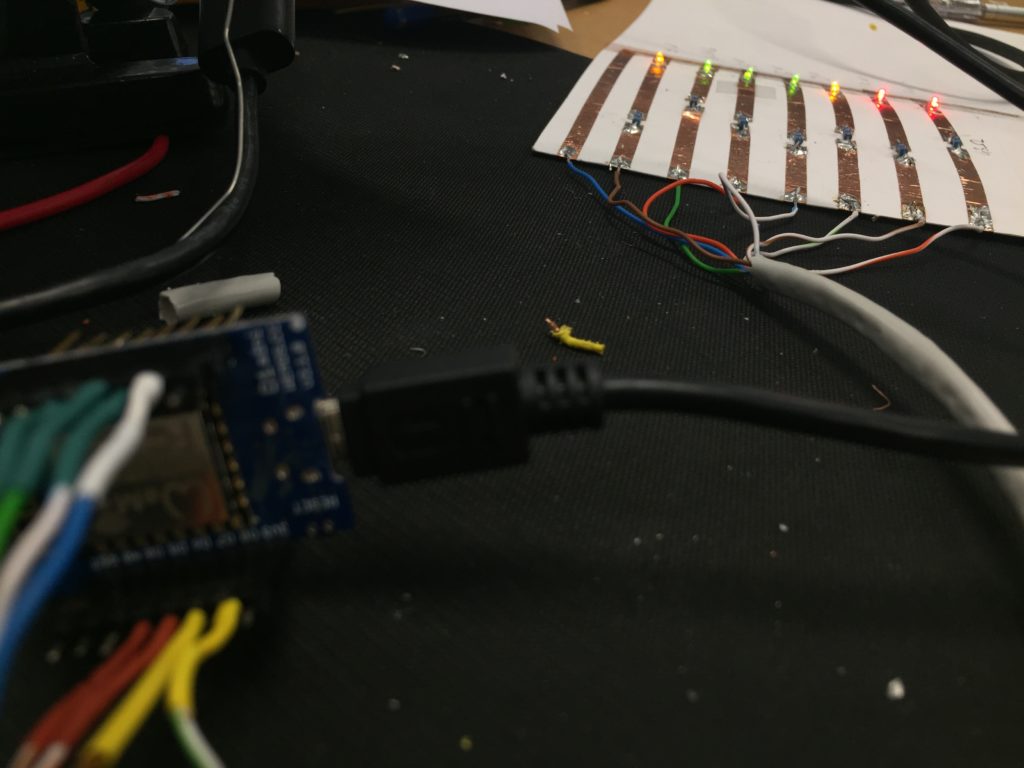
After all the LEDs are lighting up when tested with a constant 3.3V output from a desk power supply, I use a Cat5-cable to connect the paper to two sets of header pins so I can test the work with the WEMOS D1.
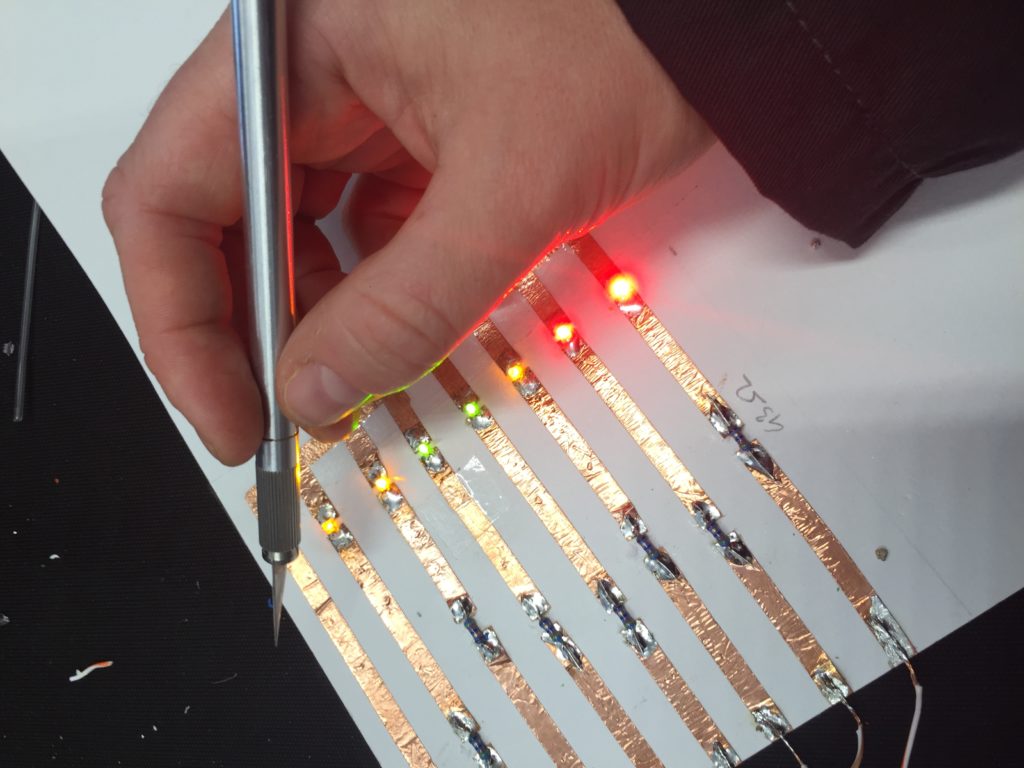
Here you can see me testing the connectivity of components on bent paper. It appears that the angled copper-tape connections are the most fragile element of the design, especially the bent overlap that I have taped down with sellotape.
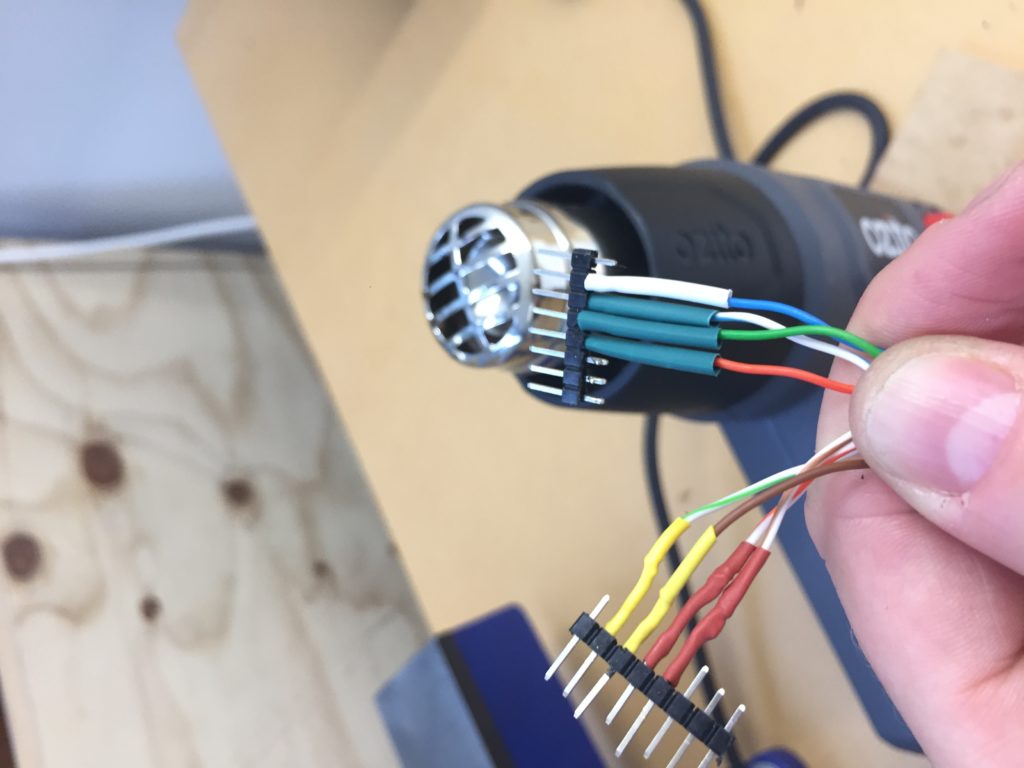
After powering the circuit with the desk power supply once more to test whether the LEDs still work with the cable bridges I add header pins to the end of the cables to provide a stable connection to the Wemos D1 mini microcontroller. I use colored heat shrink at the end of the header pins to identify cables with the respective LED color for more clarity if debugging is required later.
The next step involves addressing all LEDs correctly with the Wemos D1 mini.
I had previously noted down the temperature ranges from the SHMAK manual (NIWA, 2008) and also added all values to the header comment of the testing code for easier reference later. This information also contains the colour of CAT5-wire strand, the digital pin connected, and the range of temperature as per SHMAK kit and the colour of LED (red/yellow/green) used to represent each state.
After some bugs in my code addressing all LEDs correctly (I ended up using digital ports D1–D8) I finally got all LEDs working with a simple looping sketch.
// Kaituhituhi-rua prototype - temperature

// blue wire - G

// brown wire          D7 - <5°C – 5°C - fair:5 (yel)
// green wire          D4 - 5°C – 9.9°C - good:8 (grn)
// orange wire         D2 - 10°C – 14.9°C - excellent:10 (grn)
// blue/white wire     D4 - 15°C – 19.9°C - good:5 (grn)
// green/white wire    D8 - 20°C – 24.9°C - fair:5 (yel)
// brown/white wire    D5 - 25°C – 29.9°C - poor:0 (red)
// orange/white wire   D6 - 30°C< - poor:-5 (red)


// LEDs
int ledPins[] = {D1, D2, D3, D4, D5, D6, D7, D8};

int ledState[8];

unsigned long previousMillis = 0;

const long interval = 1000;

void setup() {
  for (int p = 0; p < 8; p++) {
    pinMode(ledPins[p], OUTPUT);
    ledState[p] = LOW;
  }
}

void loop() {
  for (int c = 0; c < 4; c++) {
    for (int p = 0; p < 8; p++) {

      digitalWrite(ledPins[p], HIGH);
    }
    delay(500);


    for (int p = 0; p < 8; p++) {

      digitalWrite(ledPins[p], LOW);

    }


    delay(500);
  }

}
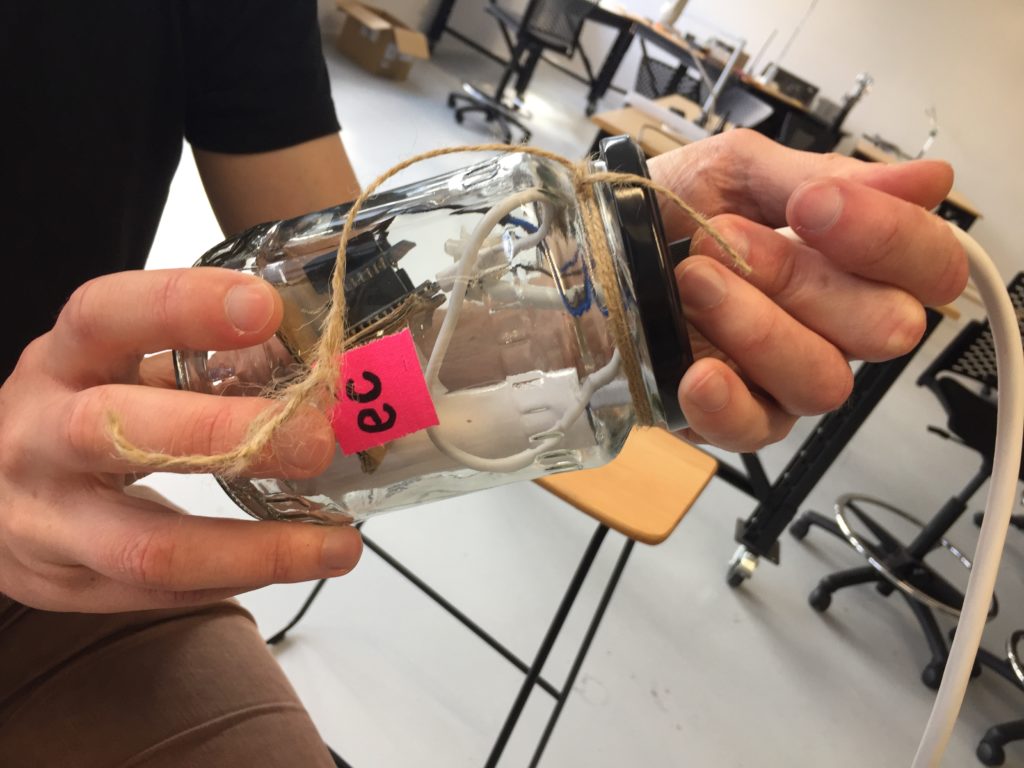
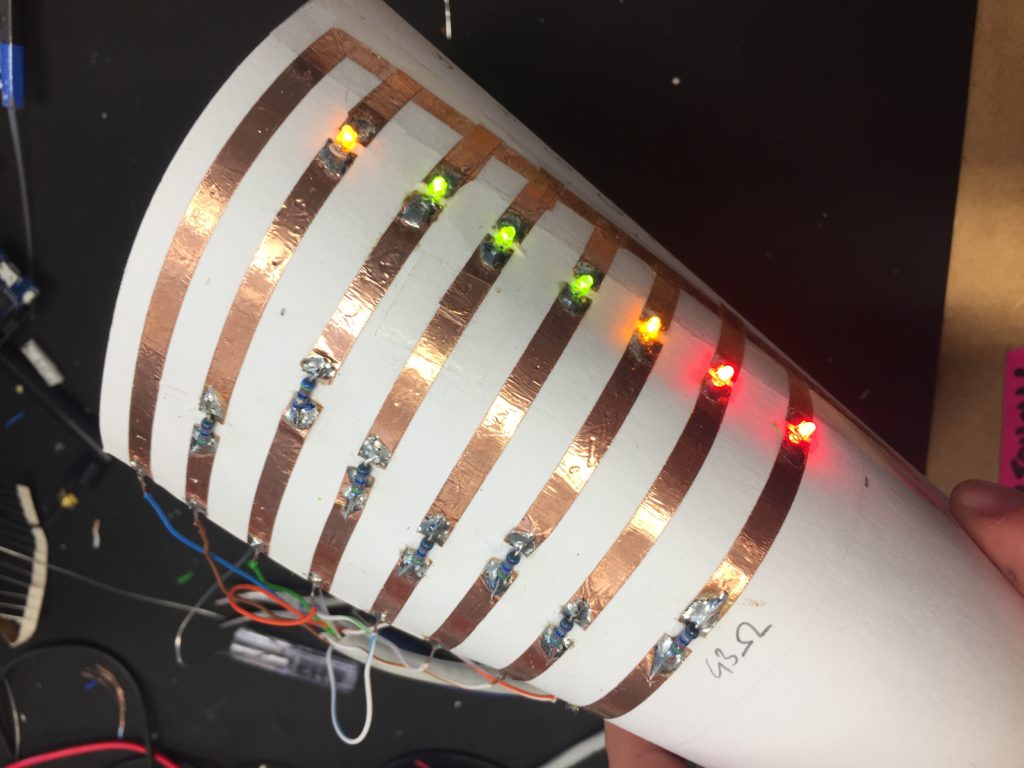
Next, I cut the paper into a smaller size and test how it fits in two different types of jars.
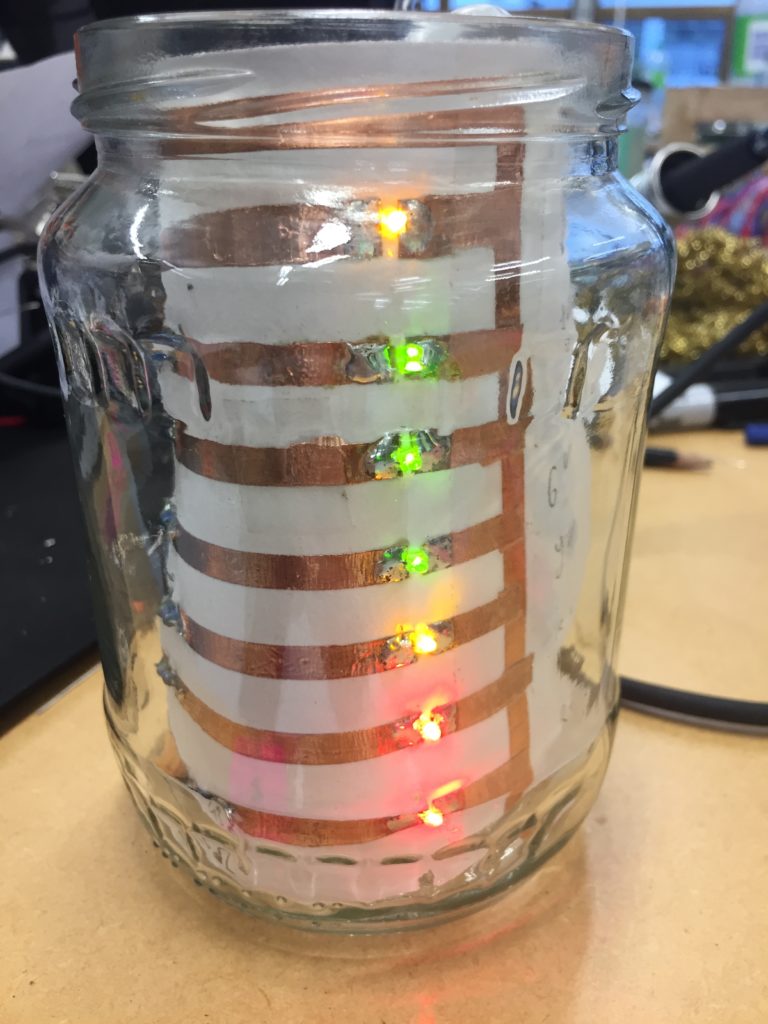
While fitting the paper into the jar I leave the microcontroller connected to evaluate how stable the solder and copper tape connections are. The power supply to the LEDs needs to remain stable while repeatedly inserting and removing the circuit from a jar. The LEDs indeed keep blinking which is a good sign. The smaller jar that was initially intended for the circuit has a pattern on the top and bottom of the glass which diffracts the LEDs and might make it hard to read.
The taller jar is clearer which makes it easier to see the LEDs, but from an aesthetical point of view, the circuit paper would have needed to be cut a bit larger to neatly fill the height of the jar.
In the end, I decide that both jars are suitable from a technical and practical perspective. The final choice of enclosure needs to be made after testing the prototype with the final code, showing only the LED of the respective temperature zone on.
High-Low Tech Group, MIT Media Lab. (2012, August 21). Paper circuits. Retrieved February 27, 2019, from http://highlowtech.org/?p=2505
Qi, J. (2012). The Fine Art of Electronics: Paper-based Circuits for Creative Expression (Master of Science in Media Arts and Sciences). Massachusetts Institute of Technology, Massachusetts, NE. Retrieved from http://web.mit.edu/~jieqi/Public/Jie_Qi_MS_thesis.pdf
To make sure I supply the right amount of voltage for my Wemos D1 mini projects I need to know a little bit more about the kinds of LEDs I intend to use.
With the Wemos D1 mini typically supplying components with 3.3 V, I need calculate the approproate resistors for my various SMD LEDs.
An online web app (“LED Resistor Calculator,” n.d.) was very handy to find the right values. Below is a table of all the LEDs I have in my stash and the most important values from their data sheet for easy reference.
Below is an image of how I use my coloured LEDs for the visualisation of water temperature in combination with resistors on a copper tape paper circuit (inspired by Qi, 2012 and High-Low Tech Group, MIT Media Lab, 2012).
High-Low Tech Group, MIT Media Lab. (2012, August 21). Paper circuits. Retrieved February 27, 2019, from http://highlowtech.org/?p=2505
Qi, J. (2012). The Fine Art of Electronics: Paper-based Circuits for Creative Expression (Master of Science in Media Arts and Sciences). Massachusetts Institute of Technology, Massachusetts, NE. Retrieved from http://web.mit.edu/~jieqi/Public/Jie_Qi_MS_thesis.pdf